|
Download Data (XLS File) |
|
||||||||
|
||||||||
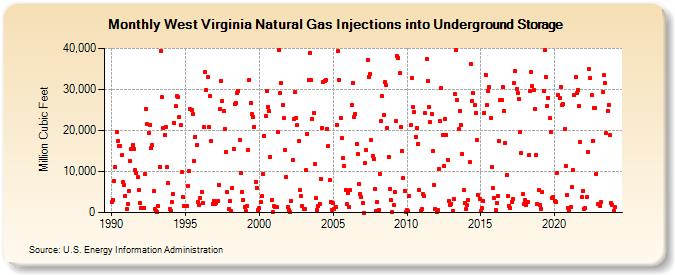
| West Virginia Natural Gas Injections into Underground Storage (Million Cubic Feet) | ||||||||
| Year | Jan | Feb | Mar | Apr | May | Jun | Jul | Aug | Sep | Oct | Nov | Dec |
|---|---|---|---|---|---|---|---|---|---|---|---|---|
| 1990 | 2,636 | 3,056 | 7,714 | 11,094 | 19,622 | 17,419 | 16,104 | 16,323 | 13,930 | 7,415 | 6,785 | 4,120 |
| 1991 | 843 | 2,207 | 5,193 | 12,543 | 15,471 | 16,359 | 15,601 | 10,248 | 9,551 | 8,573 | 5,375 | 2,288 |
| 1992 | 1,013 | 1,191 | 1,116 | 9,299 | 25,331 | 21,514 | 19,498 | 21,430 | 15,698 | 16,466 | 5,155 | 936 |
| 1993 | 467 | 42 | 1,620 | 11,145 | 39,477 | 28,118 | 20,621 | 18,991 | 20,910 | 11,087 | 7,110 | 863 |
| 1994 | 331 | 2,543 | 4,529 | 21,836 | 25,960 | 28,392 | 28,083 | 23,234 | 21,272 | 9,826 | 3,695 | 1,516 |
| 1995 | 1,637 | 1,663 | 6,487 | 10,136 | 25,124 | 25,049 | 23,910 | 12,599 | 18,493 | 16,438 | 2,473 | 1,948 |
| 1996 | 3,579 | 5,076 | 2,329 | 20,784 | 34,294 | 29,814 | 32,943 | 20,814 | 28,469 | 17,457 | 2,164 | 2,890 |
| 1997 | 1,987 | 2,401 | 2,869 | 6,756 | 25,269 | 32,158 | 27,135 | 24,684 | 20,412 | 14,862 | 4,930 | 836 |
| 1998 | 2,712 | 287 | 5,984 | 15,525 | 26,382 | 26,802 | 29,118 | 29,656 | 17,794 | 9,720 | 5,054 | 3,158 |
| 1999 | 1,385 | 407 | 1,630 | 15,251 | 32,387 | 26,754 | 23,893 | 23,378 | 20,849 | 7,504 | 6,035 | 692 |
| 2000 | 1,011 | 2,488 | 3,920 | 9,344 | 18,599 | 23,423 | 29,500 | 25,766 | 24,639 | 13,619 | 2,949 | 101 |
| 2001 | 1,526 | 1,353 | 1,364 | 19,552 | 39,695 | 29,111 | 31,675 | 26,128 | 22,964 | 15,311 | 8,693 | 1,358 |
| 2002 | 518 | 57 | 2,830 | 12,754 | 22,693 | 29,435 | 23,096 | 21,240 | 17,320 | 5,397 | 3,998 | 1,568 |
| 2003 | 940 | 817 | 10,282 | 19,252 | 32,304 | 38,942 | 32,268 | 22,813 | 24,309 | 11,767 | 3,475 | 627 |
| 2004 | 1,695 | 2,192 | 8,124 | 20,548 | 31,862 | 32,153 | 32,269 | 20,459 | 16,235 | 7,852 | 2,524 | 573 |
| 2005 | 2,262 | 977 | 1,472 | 21,351 | 39,313 | 32,354 | 23,085 | 18,265 | 13,334 | 11,302 | 5,497 | 1,988 |
| 2006 | 4,651 | 1,450 | 5,551 | 26,196 | 31,486 | 23,247 | 24,057 | 16,798 | 14,305 | 7,061 | 4,521 | 3,701 |
| 2007 | 2,396 | 10 | 12,028 | 15,260 | 37,172 | 33,022 | 33,822 | 17,579 | 13,866 | 13,050 | 5,660 | 301 |
| 2008 | 2,513 | 734 | 9,455 | 22,205 | 28,308 | 23,881 | 31,702 | 31,007 | 20,583 | 13,611 | 5,748 | 2,982 |
| 2009 | 131 | 1,761 | 5,038 | 22,215 | 38,083 | 37,713 | 33,933 | 20,869 | 14,990 | 8,462 | 5,269 | 74 |
| 2010 | 509 | 374 | 4,142 | 21,255 | 32,778 | 25,704 | 24,558 | 18,514 | 20,580 | 16,766 | 5,610 | 389 |
| 2011 | 775 | 4,414 | 4,041 | 24,164 | 37,470 | 32,119 | 25,792 | 22,031 | 24,027 | 14,927 | 6,694 | 746 |
| 2012 | 221 | 535 | 10,652 | 22,247 | 30,253 | 18,882 | 11,392 | 22,897 | 18,899 | 12,827 | 2,897 | 1,777 |
| 2013 | 2,196 | 332 | 3,328 | 28,835 | 39,494 | 27,407 | 20,288 | 24,686 | 21,235 | 14,281 | 5,450 | 2,375 |
| 2014 | 792 | 1,761 | 3,097 | 12,240 | 36,259 | 27,277 | 29,038 | 26,092 | 24,272 | 17,711 | 4,217 | 3,376 |
| 2015 | 265 | 1,110 | 2,779 | 24,324 | 33,591 | 26,109 | 29,554 | 30,474 | 22,976 | 11,106 | 5,919 | 3,512 |
| 2016 | 734 | 2,318 | 4,083 | 17,385 | 27,507 | 27,482 | 30,576 | 24,825 | 16,993 | 9,227 | 4,007 | 1,545 |
| 2017 | 1,087 | 2,667 | 3,283 | 31,681 | 34,392 | 30,156 | 29,192 | 27,552 | 19,544 | 14,508 | 4,426 | 2,104 |
| 2018 | 3,035 | 1,913 | 2,668 | 13,915 | 29,604 | 34,220 | 30,718 | 29,863 | 25,184 | 13,932 | 2,037 | 5,516 |
| 2019 | 1,792 | 874 | 5,030 | 29,692 | 39,641 | 33,086 | 25,978 | 27,979 | 22,949 | 19,606 | 3,553 | 3,886 |
| 2020 | 2,813 | 2,590 | 9,666 | 28,619 | 27,867 | 30,587 | 26,125 | 26,345 | 20,251 | 11,420 | 4,212 | 1,109 |
| 2021 | 671 | 1,377 | 6,218 | 10,420 | 28,756 | 32,946 | 29,041 | 29,839 | 26,083 | 17,241 | 3,749 | 5,341 |
| 2022 | 895 | 997 | 3,764 | 14,818 | 35,025 | 32,799 | 28,648 | 17,536 | 25,596 | 25,397 | 9,515 | 2,102 |
| 2023 | 2,128 | 1,711 | 2,586 | 29,261 | 33,400 | 31,660 | 19,270 | 24,807 | 26,315 | 18,804 | 2,296 | 1,949 |
| 2024 | 489 | 1,266 | 6,107 | 29,180 | 41,564 | 28,366 | ||||||
| - = No Data Reported; -- = Not Applicable; NA = Not Available; W = Withheld to avoid disclosure of individual company data. |
| Release Date: 8/30/2024 |
| Next Release Date: 9/30/2024 |