|
Download Data (XLS File) |
|
||||||||
|
||||||||
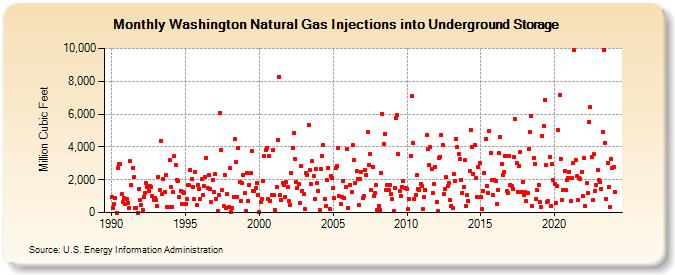
| Washington Natural Gas Injections into Underground Storage (Million Cubic Feet) | ||||||||
| Year | Jan | Feb | Mar | Apr | May | Jun | Jul | Aug | Sep | Oct | Nov | Dec |
|---|---|---|---|---|---|---|---|---|---|---|---|---|
| 1990 | 929 | 289 | 499 | 863 | 0 | 2,707 | 2,937 | 2,937 | 1,101 | 622 | 906 | 507 |
| 1991 | 833 | 586 | 299 | 3,139 | 1,705 | 2,716 | 2,138 | 291 | 308 | 0 | 1,447 | 753 |
| 1992 | 436 | 149 | 945 | 1,205 | 1,824 | 1,543 | 1,336 | 1,618 | 1,578 | 979 | 785 | 895 |
| 1993 | 750 | 383 | 2,192 | 1,363 | 4,359 | 1,112 | 2,036 | 1,280 | 2,258 | 340 | 326 | 3,176 |
| 1994 | 1,579 | 318 | 1,268 | 3,455 | 2,882 | 2,005 | 1,945 | 965 | 1,330 | 503 | 1,263 | 1,192 |
| 1995 | 541 | 827 | 1,671 | 1,661 | 2,601 | 2,020 | 1,565 | 829 | 2,494 | 464 | 1,696 | 1,447 |
| 1996 | 808 | 2,027 | 1,081 | 1,609 | 2,176 | 3,349 | 1,470 | 2,279 | 1,441 | 655 | 1,978 | 1,252 |
| 1997 | 2,356 | 844 | 100 | 1,041 | 6,091 | 3,816 | 1,351 | 399 | 2,304 | 257 | 1,145 | 313 |
| 1998 | 2,718 | 32 | 296 | 937 | 4,485 | 3,086 | 967 | 3,957 | 1,836 | 722 | 1,817 | 2,284 |
| 1999 | 1,177 | 68 | 2,402 | 704 | 1,697 | 2,392 | 3,764 | 1,341 | 1,341 | 1,472 | 1,814 | 1,056 |
| 2000 | 48 | 638 | 828 | 1,893 | 3,446 | 3,794 | 3,907 | 807 | 3,443 | 732 | 1,051 | 3,837 |
| 2001 | 1,085 | 145 | 1,557 | 4,445 | 8,283 | 1,049 | 772 | 1,794 | 1,703 | 968 | 1,847 | 1,527 |
| 2002 | 675 | 476 | 2,411 | 3,953 | 4,827 | 3,234 | 1,859 | 1,512 | 1,712 | 584 | 2,812 | 1,323 |
| 2003 | 1,134 | 220 | 2,383 | 2,309 | 5,336 | 2,580 | 1,725 | 3,144 | 2,239 | 826 | 2,671 | 1,790 |
| 2004 | 1,342 | 129 | 2,640 | 3,460 | 4,125 | 813 | 403 | 2,010 | 2,721 | 207 | 2,222 | 2,122 |
| 2005 | 1,521 | 858 | 2,735 | 2,806 | 3,936 | 984 | 546 | 962 | 1,930 | 877 | 1,557 | 3,850 |
| 2006 | 296 | 1,673 | 1,259 | 4,102 | 3,230 | 1,820 | 2,560 | 2,061 | 450 | 2,055 | 2,491 | |
| 2007 | 886 | 1,033 | 2,587 | 2,311 | 4,882 | 2,908 | 3,556 | 1,372 | 2,791 | 992 | 1,185 | 1,680 |
| 2008 | 162 | 377 | 135 | 2,394 | 6,015 | 4,182 | 4,802 | 1,373 | 1,708 | 1,389 | 1,659 | 1,108 |
| 2009 | 812 | 68 | 1,499 | 5,777 | 5,915 | 3,560 | 1,299 | 1,020 | 1,565 | 1,901 | 1,469 | 1,526 |
| 2010 | 1,459 | 211 | 813 | 3,441 | 7,088 | 4,224 | 848 | 1,061 | 2,259 | 1,438 | 1,368 | 1,759 |
| 2011 | 1,614 | 232 | 923 | 1,383 | 4,712 | 3,857 | 2,900 | 3,988 | 2,625 | 1,188 | 1,770 | 2,753 |
| 2012 | 646 | 67 | 3,314 | 3,413 | 4,750 | 4,136 | 1,124 | 1,432 | 2,145 | 1,595 | 1,798 | 763 |
| 2013 | 420 | 259 | 2,358 | 1,892 | 4,479 | 3,999 | 3,570 | 3,251 | 2,006 | 1,211 | 1,552 | 3,211 |
| 2014 | 419 | 1,045 | 707 | 2,521 | 5,035 | 3,989 | 2,376 | 4,091 | 2,091 | 975 | 2,805 | 3,004 |
| 2015 | 929 | 196 | 1,299 | 2,425 | 4,504 | 1,623 | 1,206 | 4,954 | 3,653 | 1,967 | 1,065 | 1,968 |
| 2016 | 1,951 | 503 | 1,362 | 3,616 | 4,607 | 2,973 | 2,267 | 2,470 | 3,472 | 1,316 | 1,197 | 3,437 |
| 2017 | 1,681 | 1,619 | 1,427 | 3,405 | 5,680 | 2,998 | 1,231 | 2,837 | 3,692 | 1,274 | 1,864 | 1,080 |
| 2018 | 1,237 | 687 | 1,198 | 3,885 | 4,889 | 5,879 | 402 | 3,325 | 2,975 | 825 | 1,352 | 1,683 |
| 2019 | 663 | 343 | 4,652 | 5,286 | 6,859 | 2,871 | 615 | 682 | 3,410 | 385 | 2,940 | 1,959 |
| 2020 | 1,754 | 578 | 1,615 | 5,001 | 7,163 | 3,288 | 789 | 1,387 | 2,528 | 1,402 | 2,005 | 2,108 |
| 2021 | 2,486 | 703 | 2,100 | 3,017 | 9,925 | 3,212 | 2,220 | 749 | 2,132 | 2,055 | 2,463 | 1,013 |
| 2022 | 3,339 | 380 | 1,774 | 1,187 | 5,511 | 6,414 | 3,387 | 744 | 3,552 | 1,312 | 1,708 | 2,609 |
| 2023 | 1,966 | 1,860 | 1,443 | 4,900 | 9,931 | 4,238 | 837 | 3,015 | 1,580 | 356 | 3,259 | 2,709 |
| 2024 | 2,799 | |||||||||||
| - = No Data Reported; -- = Not Applicable; NA = Not Available; W = Withheld to avoid disclosure of individual company data. |
| Release Date: 3/29/2024 |
| Next Release Date: 4/30/2024 |