|
Download Data (XLS File) |
|
||||||||
|
||||||||
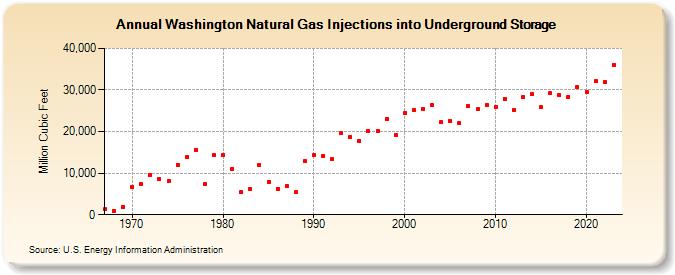
| Washington Natural Gas Injections into Underground Storage (Million Cubic Feet) | ||||||||
| Decade | Year-0 | Year-1 | Year-2 | Year-3 | Year-4 | Year-5 | Year-6 | Year-7 | Year-8 | Year-9 |
|---|---|---|---|---|---|---|---|---|---|---|
| 1960's | 1,270 | 974 | 1,827 | |||||||
| 1970's | 6,688 | 7,442 | 9,608 | 8,598 | 7,993 | 12,009 | 13,858 | 15,540 | 7,358 | 14,332 |
| 1980's | 14,408 | 11,083 | 5,344 | 6,218 | 12,002 | 7,847 | 6,269 | 6,884 | 5,415 | 12,921 |
| 1990's | 14,296 | 14,214 | 13,294 | 19,575 | 18,705 | 17,815 | 20,124 | 20,018 | 23,136 | 19,227 |
| 2000's | 24,424 | 25,176 | 25,378 | 26,357 | 22,194 | 22,562 | 21,997 | 26,184 | 25,304 | 26,411 |
| 2010's | 25,968 | 27,946 | 25,183 | 28,208 | 29,058 | 25,789 | 29,172 | 28,788 | 28,339 | 30,665 |
| 2020's | 29,618 | 32,076 | 31,917 | 36,093 |
| - = No Data Reported; -- = Not Applicable; NA = Not Available; W = Withheld to avoid disclosure of individual company data. |
| Release Date: 3/29/2024 |
| Next Release Date: 4/30/2024 |