|
Download Data (XLS File) |
|
||||||||
|
||||||||
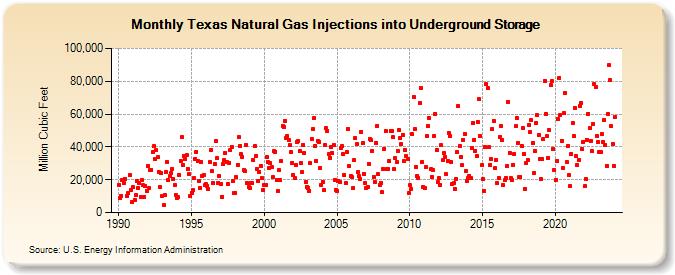
| Texas Natural Gas Injections into Underground Storage (Million Cubic Feet) | ||||||||
| Year | Jan | Feb | Mar | Apr | May | Jun | Jul | Aug | Sep | Oct | Nov | Dec |
|---|---|---|---|---|---|---|---|---|---|---|---|---|
| 1990 | 17,004 | 8,785 | 10,204 | 19,677 | 17,706 | 20,683 | 10,352 | 12,126 | 22,756 | 13,644 | 6,455 | |
| 1991 | 15,296 | 7,922 | 10,668 | 19,418 | 15,195 | 17,722 | 9,489 | 19,572 | 16,485 | 9,703 | 16,161 | 13,277 |
| 1992 | 28,613 | 14,959 | 26,061 | 25,971 | 36,754 | 40,361 | 32,383 | 37,832 | 33,591 | 24,896 | 15,309 | 23,871 |
| 1993 | 10,338 | 4,336 | 10,991 | 24,985 | 30,856 | 19,793 | 22,155 | 23,862 | 26,751 | 20,149 | 16,519 | 10,678 |
| 1994 | 9,151 | 9,187 | 22,843 | 31,648 | 45,809 | 29,041 | 34,716 | 32,744 | 34,998 | 26,664 | 23,258 | 10,215 |
| 1995 | 12,078 | 13,562 | 21,198 | 32,724 | 36,914 | 31,661 | 19,399 | 14,823 | 30,725 | 22,198 | 22,893 | 16,550 |
| 1996 | 17,258 | 16,375 | 14,468 | 30,538 | 38,091 | 25,167 | 17,853 | 29,559 | 43,300 | 32,988 | 18,026 | 22,291 |
| 1997 | 17,257 | 9,764 | 29,470 | 31,892 | 36,354 | 30,670 | 17,632 | 30,457 | 37,900 | 39,981 | 19,084 | 11,795 |
| 1998 | 12,169 | 21,552 | 29,158 | 45,927 | 40,575 | 35,386 | 34,086 | 25,632 | 25,093 | 41,377 | 17,913 | 15,593 |
| 1999 | 15,054 | 18,052 | 17,875 | 32,085 | 40,358 | 34,550 | 26,810 | 19,188 | 24,744 | 28,563 | 20,862 | 13,661 |
| 2000 | 16,842 | 17,011 | 33,695 | 30,676 | 27,366 | 30,037 | 27,519 | 21,428 | 37,211 | 37,193 | 19,741 | 13,276 |
| 2001 | 25,740 | 19,559 | 31,553 | 52,874 | 51,970 | 55,965 | 45,464 | 46,575 | 44,140 | 41,020 | 37,030 | 30,378 |
| 2002 | 22,920 | 21,024 | 29,158 | 43,145 | 43,431 | 37,210 | 30,238 | 24,514 | 41,300 | 36,323 | 18,607 | 15,812 |
| 2003 | 15,228 | 13,417 | 30,038 | 45,076 | 50,849 | 57,563 | 40,805 | 31,658 | 43,694 | 43,156 | 27,125 | 16,933 |
| 2004 | 18,874 | 13,626 | 41,036 | 51,228 | 49,965 | 35,415 | 33,504 | 40,133 | 36,195 | 41,163 | 20,099 | 13,877 |
| 2005 | 13,048 | 19,135 | 18,707 | 39,341 | 40,638 | 35,532 | 22,951 | 18,014 | 37,051 | 51,136 | 28,206 | 22,184 |
| 2006 | 21,618 | 14,786 | 31,780 | 45,470 | 41,712 | 24,767 | 22,218 | 20,309 | 49,198 | 42,443 | 23,713 | 18,260 |
| 2007 | 14,836 | 15,537 | 29,590 | 44,508 | 44,006 | 37,657 | 21,870 | 18,836 | 42,553 | 52,950 | 23,203 | 17,047 |
| 2008 | 18,245 | 12,368 | 26,819 | 38,937 | 49,609 | 26,426 | 26,434 | 31,473 | 49,532 | 49,492 | 45,866 | 26,399 |
| 2009 | 32,954 | 30,855 | 37,719 | 50,103 | 45,655 | 41,642 | 47,499 | 31,297 | 38,360 | 34,350 | 32,847 | 11,807 |
| 2010 | 16,592 | 14,392 | 47,957 | 70,263 | 50,751 | 27,905 | 22,296 | 20,902 | 66,808 | 76,050 | 30,825 | 15,712 |
| 2011 | 14,701 | 27,683 | 46,564 | 52,819 | 57,561 | 26,348 | 21,860 | 26,048 | 46,692 | 60,175 | 38,331 | 18,658 |
| 2012 | 20,803 | 16,907 | 40,922 | 31,837 | 36,051 | 34,024 | 23,250 | 31,347 | 48,538 | 46,723 | 30,889 | 17,147 |
| 2013 | 17,743 | 14,410 | 20,442 | 36,921 | 64,838 | 40,536 | 33,867 | 28,666 | 44,433 | 47,971 | 25,137 | 19,412 |
| 2014 | 20,913 | 22,482 | 21,058 | 39,369 | 54,635 | 44,458 | 37,649 | 34,427 | 55,239 | 68,897 | 46,376 | 28,887 |
| 2015 | 20,542 | 13,063 | 39,696 | 78,280 | 75,834 | 39,661 | 28,951 | 32,731 | 50,816 | 56,019 | 26,996 | 31,787 |
| 2016 | 17,953 | 21,048 | 46,257 | 52,553 | 44,466 | 16,715 | 19,641 | 21,283 | 28,346 | 67,536 | 36,399 | 20,769 |
| 2017 | 20,090 | 28,987 | 35,803 | 52,460 | 57,430 | 42,525 | 21,913 | 21,742 | 40,752 | 51,682 | 35,681 | 14,524 |
| 2018 | 30,201 | 31,778 | 53,204 | 48,915 | 56,260 | 42,267 | 24,233 | 37,738 | 54,465 | 59,186 | 47,306 | 32,699 |
| 2019 | 20,266 | 32,536 | 44,827 | 80,205 | 60,261 | 46,411 | 33,193 | 50,141 | 77,430 | 79,955 | 38,932 | 26,031 |
| 2020 | 19,791 | 31,314 | 56,965 | 82,041 | 59,569 | 43,843 | 27,234 | 60,349 | 72,848 | 30,732 | 40,387 | 22,775 |
| 2021 | 16,109 | 35,619 | 54,633 | 46,770 | 63,869 | 34,218 | 29,100 | 32,285 | 64,826 | 66,775 | 38,831 | 43,027 |
| 2022 | 15,964 | 20,716 | 44,425 | 60,331 | 51,603 | 43,595 | 37,266 | 53,674 | 78,018 | 76,479 | 46,637 | 43,273 |
| 2023 | 36,889 | 36,927 | 47,731 | 43,249 | 56,334 | 41,183 | 28,596 | 60,249 | 89,611 | 80,555 | 52,426 | 41,766 |
| 2024 | 28,514 | |||||||||||
| - = No Data Reported; -- = Not Applicable; NA = Not Available; W = Withheld to avoid disclosure of individual company data. |
| Release Date: 3/29/2024 |
| Next Release Date: 4/30/2024 |