|
Download Data (XLS File) |
|
||||||||
|
||||||||
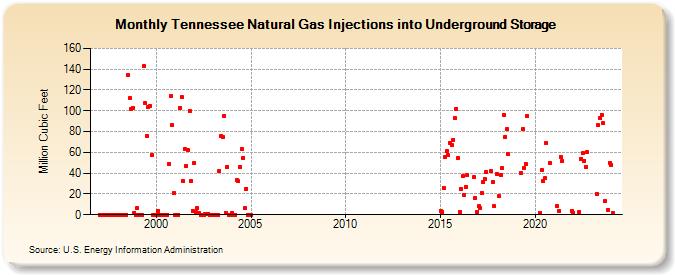
| Tennessee Natural Gas Injections into Underground Storage (Million Cubic Feet) | ||||||||
| Year | Jan | Feb | Mar | Apr | May | Jun | Jul | Aug | Sep | Oct | Nov | Dec |
|---|---|---|---|---|---|---|---|---|---|---|---|---|
| 1997 | 0 | 0 | 0 | 0 | 0 | 0 | 0 | 0 | 0 | 0 | 0 | 0 |
| 1998 | 0 | 0 | 0 | 0 | 0 | 0 | 134 | 112 | 102 | 103 | 2 | 0 |
| 1999 | 6 | 0 | 0 | 0 | 143 | 107 | 76 | 104 | 105 | 57 | 0 | 0 |
| 2000 | 0 | 4 | 0 | 0 | 0 | 0 | 0 | 0 | 49 | 114 | 86 | 21 |
| 2001 | 0 | 0 | 0 | 103 | 113 | 32 | 63 | 47 | 62 | 100 | 32 | 4 |
| 2002 | 50 | 3 | 6 | 2 | 0 | 0 | 0 | 1 | 1 | 1 | 0 | 0 |
| 2003 | 0 | 0 | 0 | 0 | 42 | 76 | 75 | 95 | 2 | 46 | 0 | 0 |
| 2004 | 2 | 0 | 0 | 33 | 32 | 46 | 63 | 55 | 6 | 25 | 0 | 0 |
| 2005 | 0 | |||||||||||
| 2015 | 4 | 3 | 26 | 56 | 61 | 57 | 69 | 67 | 72 | 93 | 102 | 55 |
| 2016 | 3 | 25 | 37 | 19 | 27 | 38 | 36 | 16 | 3 | |||
| 2017 | 8 | 6 | 21 | 31 | 34 | 41 | 42 | 31 | 8 | |||
| 2018 | 39 | 18 | 38 | 45 | 96 | 75 | 82 | 58 | ||||
| 2019 | 40 | 82 | 45 | 49 | 95 | |||||||
| 2020 | 2 | 43 | 32 | 35 | 69 | 50 | ||||||
| 2021 | 8 | 4 | 56 | 52 | 4 | |||||||
| 2022 | 2 | 3 | 54 | 59 | 52 | 46 | 60 | |||||
| 2023 | 20 | 86 | 93 | 96 | 88 | 13 | 5 | 50 | ||||
| 2024 | 48 | |||||||||||
| - = No Data Reported; -- = Not Applicable; NA = Not Available; W = Withheld to avoid disclosure of individual company data. |
| Release Date: 3/29/2024 |
| Next Release Date: 4/30/2024 |