|
Download Data (XLS File) |
|
||||||||
|
||||||||
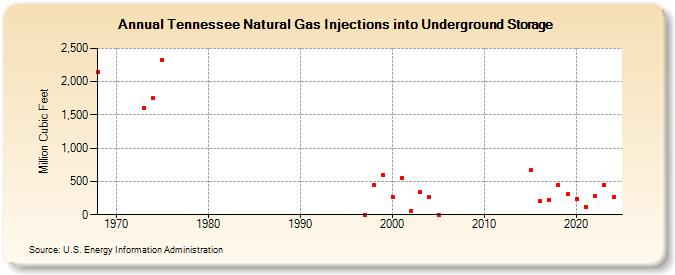
| Tennessee Natural Gas Injections into Underground Storage (Million Cubic Feet) | ||||||||
| Decade | Year-0 | Year-1 | Year-2 | Year-3 | Year-4 | Year-5 | Year-6 | Year-7 | Year-8 | Year-9 |
|---|---|---|---|---|---|---|---|---|---|---|
| 1960's | 2,140 | |||||||||
| 1970's | 1,606 | 1,750 | 2,325 | |||||||
| 1990's | 0 | 453 | 599 | |||||||
| 2000's | 273 | 556 | 63 | 336 | 262 | 0 | ||||
| 2010's | 665 | 205 | 223 | 452 | 311 | |||||
| 2020's | 231 | 123 | 275 | 453 |
| - = No Data Reported; -- = Not Applicable; NA = Not Available; W = Withheld to avoid disclosure of individual company data. |
| Release Date: 3/29/2024 |
| Next Release Date: 4/30/2024 |