|
Download Data (XLS File) |
|
||||||||
|
||||||||
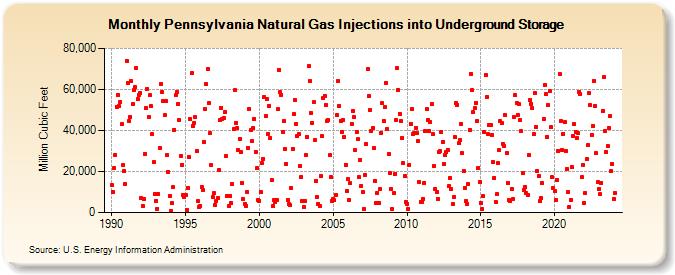
| Pennsylvania Natural Gas Injections into Underground Storage (Million Cubic Feet) | ||||||||
| Year | Jan | Feb | Mar | Apr | May | Jun | Jul | Aug | Sep | Oct | Nov | Dec |
|---|---|---|---|---|---|---|---|---|---|---|---|---|
| 1990 | 13,295 | 9,924 | 21,742 | 28,238 | 51,655 | 57,413 | 51,832 | 54,045 | 43,121 | 22,964 | 20,337 | 14,002 |
| 1991 | 73,993 | 63,063 | 44,655 | 46,683 | 64,031 | 52,754 | 59,771 | 61,123 | 70,362 | 55,270 | 57,416 | 58,249 |
| 1992 | 7,189 | 3,229 | 6,490 | 28,679 | 50,918 | 60,273 | 46,504 | 57,126 | 51,685 | 38,133 | 24,553 | 8,982 |
| 1993 | 5,815 | 1,906 | 9,046 | 31,461 | 62,602 | 58,643 | 54,419 | 47,350 | 54,543 | 27,811 | 19,970 | 8,144 |
| 1994 | 772 | 4,575 | 12,272 | 40,407 | 57,110 | 58,758 | 53,083 | 45,208 | 27,767 | 23,356 | 8,648 | 7,555 |
| 1995 | 8,380 | 1,289 | 12,108 | 27,140 | 45,415 | 67,781 | 42,232 | 43,699 | 46,409 | 30,000 | 5,446 | 2,709 |
| 1996 | 3,214 | 12,492 | 11,126 | 34,558 | 50,461 | 62,584 | 69,768 | 53,355 | 38,592 | 23,095 | 7,655 | 9,389 |
| 1997 | 3,821 | 5,710 | 7,062 | 20,637 | 45,037 | 51,177 | 45,716 | 46,131 | 49,094 | 27,343 | 8,090 | 2,969 |
| 1998 | 7,984 | 4,426 | 13,771 | 40,673 | 59,545 | 43,824 | 41,028 | 30,450 | 35,785 | 29,389 | 14,620 | 6,623 |
| 1999 | 4,401 | 3,364 | 10,140 | 31,601 | 50,437 | 40,125 | 34,672 | 41,008 | 45,711 | 29,625 | 21,609 | 6,348 |
| 2000 | 5,810 | 10,233 | 24,015 | 26,316 | 56,361 | 46,974 | 55,204 | 38,518 | 52,097 | 36,439 | 15,816 | 3,173 |
| 2001 | 6,001 | 5,190 | 6,241 | 50,224 | 69,663 | 58,571 | 57,442 | 39,184 | 44,660 | 30,898 | 23,881 | 6,078 |
| 2002 | 4,004 | 3,694 | 12,158 | 31,164 | 48,083 | 54,700 | 43,216 | 37,258 | 38,292 | 22,624 | 17,322 | 5,863 |
| 2003 | 2,718 | 5,579 | 28,149 | 36,836 | 71,291 | 63,987 | 48,522 | 43,809 | 53,746 | 35,179 | 15,570 | 7,690 |
| 2004 | 4,338 | 2,999 | 17,866 | 37,423 | 55,920 | 56,931 | 52,589 | 44,623 | 45,077 | 28,003 | 17,281 | 5,848 |
| 2005 | 6,548 | 5,951 | 8,708 | 47,462 | 64,158 | 52,105 | 44,793 | 39,280 | 45,338 | 36,831 | 23,398 | 10,614 |
| 2006 | 16,124 | 6,126 | 14,258 | 43,285 | 49,551 | 46,610 | 30,280 | 39,497 | 35,676 | 17,224 | 25,711 | 12,999 |
| 2007 | 10,040 | 1,808 | 18,427 | 33,524 | 69,766 | 57,038 | 50,153 | 39,682 | 40,966 | 31,437 | 15,477 | 4,620 |
| 2008 | 9,760 | 4,787 | 11,283 | 38,921 | 53,265 | 44,848 | 51,260 | 63,353 | 40,675 | 28,524 | 19,323 | 11,404 |
| 2009 | 1,608 | 9,338 | 18,780 | 44,914 | 70,282 | 59,834 | 48,231 | 44,706 | 36,239 | 24,007 | 17,766 | 5,281 |
| 2010 | 4,313 | 1,870 | 23,400 | 43,211 | 50,536 | 38,294 | 38,591 | 41,333 | 38,584 | 34,642 | 15,103 | 5,191 |
| 2011 | 5,354 | 6,693 | 14,623 | 39,801 | 50,294 | 45,149 | 39,856 | 44,217 | 52,668 | 38,301 | 22,778 | 11,606 |
| 2012 | 10,147 | 6,843 | 29,388 | 29,863 | 39,312 | 34,270 | 23,728 | 28,083 | 29,598 | 30,541 | 12,700 | 17,034 |
| 2013 | 11,457 | 4,186 | 7,641 | 36,646 | 53,408 | 52,634 | 33,723 | 35,316 | 43,164 | 28,898 | 20,337 | 12,184 |
| 2014 | 5,576 | 4,260 | 13,850 | 40,388 | 67,625 | 59,504 | 48,841 | 51,006 | 53,532 | 44,543 | 21,893 | 14,823 |
| 2015 | 4,844 | 1,844 | 7,983 | 39,304 | 66,942 | 56,369 | 38,067 | 42,572 | 42,529 | 37,962 | 24,482 | 17,010 |
| 2016 | 5,148 | 8,852 | 24,088 | 30,454 | 44,376 | 43,461 | 33,602 | 32,236 | 47,396 | 29,026 | 14,564 | 6,186 |
| 2017 | 5,715 | 11,638 | 6,481 | 46,638 | 57,233 | 53,290 | 47,605 | 52,768 | 44,914 | 39,502 | 19,264 | 10,834 |
| 2018 | 12,550 | 9,439 | 8,435 | 27,916 | 55,003 | 53,088 | 50,931 | 38,087 | 58,348 | 41,756 | 20,020 | 17,969 |
| 2019 | 5,473 | 7,149 | 14,164 | 45,508 | 62,042 | 57,757 | 37,017 | 52,307 | 59,072 | 41,619 | 17,149 | 11,810 |
| 2020 | 10,378 | 6,294 | 15,911 | 30,156 | 67,472 | 44,374 | 30,644 | 38,451 | 43,978 | 30,237 | 21,314 | 9,937 |
| 2021 | 2,757 | 6,304 | 21,981 | 37,464 | 43,079 | 39,317 | 36,305 | 38,690 | 58,884 | 57,799 | 17,129 | 23,235 |
| 2022 | 4,748 | 9,488 | 25,951 | 32,731 | 58,368 | 52,217 | 38,031 | 42,220 | 64,253 | 51,878 | 28,830 | 14,672 |
| 2023 | 11,699 | 8,986 | 14,586 | 49,565 | 65,985 | 39,827 | 29,444 | 32,546 | 41,264 | 47,059 | 20,356 | 23,904 |
| 2024 | 6,671 | 9,724 | 27,211 | 47,770 | 58,813 | 43,532 | ||||||
| - = No Data Reported; -- = Not Applicable; NA = Not Available; W = Withheld to avoid disclosure of individual company data. |
| Release Date: 8/30/2024 |
| Next Release Date: 9/30/2024 |