|
Download Data (XLS File) |
|
||||||||
|
||||||||
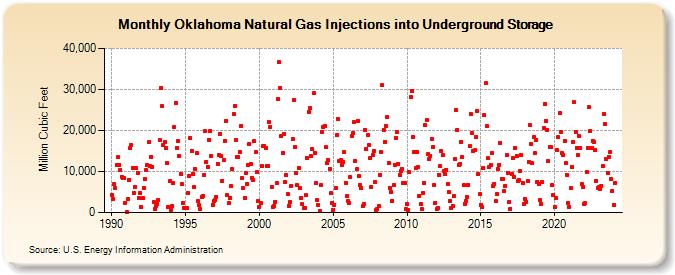
| Oklahoma Natural Gas Injections into Underground Storage (Million Cubic Feet) | ||||||||
| Year | Jan | Feb | Mar | Apr | May | Jun | Jul | Aug | Sep | Oct | Nov | Dec |
|---|---|---|---|---|---|---|---|---|---|---|---|---|
| 1990 | 4,366 | 3,193 | 6,903 | 5,872 | 11,548 | 13,440 | 11,689 | 10,380 | 8,709 | 8,453 | 8,353 | 2,367 |
| 1991 | 26 | 3,253 | 7,982 | 15,800 | 16,462 | 10,864 | 4,815 | 6,272 | 10,749 | 9,706 | 3,437 | 4,853 |
| 1992 | 1,358 | 3,452 | 5,980 | 8,163 | 10,270 | 11,596 | 17,116 | 11,326 | 13,627 | 11,199 | 2,570 | 812 |
| 1993 | 1,709 | 2,183 | 3,139 | 17,592 | 30,401 | 25,865 | 16,422 | 17,249 | 15,631 | 12,044 | 1,415 | 7,600 |
| 1994 | 692 | 1,521 | 7,130 | 20,751 | 26,772 | 15,711 | 17,419 | 13,891 | 9,370 | 6,950 | 2,330 | 1,038 |
| 1995 | 1,144 | 1,218 | 4,867 | 9,018 | 18,190 | 15,120 | 9,480 | 6,202 | 10,541 | 14,552 | 2,750 | 1,727 |
| 1996 | 871 | 3,814 | 4,043 | 9,051 | 19,783 | 12,404 | 11,191 | 17,682 | 19,846 | 13,803 | 1,849 | 2,730 |
| 1997 | 3,164 | 3,776 | 11,894 | 14,013 | 19,122 | 13,736 | 7,711 | 12,725 | 17,542 | 22,393 | 4,205 | 2,208 |
| 1998 | 3,624 | 6,385 | 10,533 | 23,984 | 26,034 | 17,597 | 13,600 | 13,503 | 14,872 | 21,114 | 8,384 | 6,002 |
| 1999 | 3,495 | 9,676 | 6,839 | 11,613 | 16,732 | 11,903 | 8,530 | 7,857 | 17,334 | 14,699 | 9,766 | 2,869 |
| 2000 | 1,336 | 2,208 | 11,270 | 16,132 | 16,228 | 15,702 | 11,455 | 11,287 | 21,995 | 20,958 | 6,273 | 1,442 |
| 2001 | 1,650 | 2,684 | 7,081 | 27,688 | 36,584 | 30,396 | 18,642 | 14,520 | 19,178 | 7,437 | 9,075 | 4,525 |
| 2002 | 1,661 | 2,500 | 6,500 | 17,874 | 27,431 | 15,899 | 9,558 | 6,642 | 10,785 | 5,989 | 3,564 | 2,138 |
| 2003 | 1,043 | 1,121 | 4,193 | 13,265 | 24,477 | 25,403 | 13,673 | 15,489 | 29,130 | 14,573 | 7,187 | 2,981 |
| 2004 | 1,885 | 413 | 6,665 | 19,681 | 20,730 | 21,031 | 15,903 | 12,070 | 12,740 | 10,690 | 4,704 | 2,389 |
| 2005 | 701 | 1,807 | 6,030 | 18,812 | 22,828 | 12,608 | 12,721 | 11,553 | 12,397 | 14,653 | 7,279 | 3,972 |
| 2006 | 2,788 | 2,297 | 8,602 | 18,629 | 19,350 | 21,996 | 12,681 | 10,497 | 22,322 | 8,890 | 6,763 | 6,079 |
| 2007 | 1,520 | 1,969 | 20,091 | 15,512 | 18,901 | 16,342 | 13,209 | 6,344 | 13,983 | 15,054 | 7,452 | 551 |
| 2008 | 913 | 1,584 | 9,226 | 14,721 | 31,001 | 20,230 | 17,259 | 21,080 | 23,206 | 12,170 | 6,041 | 5,024 |
| 2009 | 2,892 | 6,709 | 11,620 | 18,120 | 19,545 | 11,948 | 9,113 | 10,151 | 10,584 | 7,208 | 7,191 | 805 |
| 2010 | 1,983 | 643 | 9,795 | 28,197 | 29,652 | 18,354 | 14,704 | 10,745 | 14,750 | 11,098 | 4,051 | 1,978 |
| 2011 | 793 | 4,745 | 7,164 | 21,385 | 22,620 | 14,201 | 13,080 | 13,804 | 17,927 | 15,934 | 6,656 | 2,421 |
| 2012 | 775 | 1,175 | 9,271 | 11,231 | 14,912 | 13,927 | 10,210 | 9,277 | 10,437 | 7,015 | 4,891 | 2,755 |
| 2013 | 1,015 | 1,537 | 4,024 | 13,153 | 24,901 | 20,077 | 11,613 | 11,947 | 17,112 | 13,491 | 6,615 | 2,186 |
| 2014 | 2,920 | 3,774 | 6,732 | 16,210 | 23,974 | 19,271 | 15,008 | 15,156 | 18,416 | 24,839 | 9,435 | 4,498 |
| 2015 | 1,918 | 1,348 | 10,922 | 23,771 | 31,496 | 21,020 | 13,280 | 11,175 | 11,609 | 14,397 | 6,360 | 7,073 |
| 2016 | 2,701 | 4,518 | 10,606 | 11,696 | 17,060 | 8,283 | 8,243 | 5,271 | 6,575 | 13,991 | 9,561 | 2,688 |
| 2017 | 962 | 9,461 | 13,210 | 8,730 | 15,716 | 13,882 | 7,709 | 7,852 | 10,058 | 13,922 | 7,103 | 2,080 |
| 2018 | 3,407 | 2,693 | 7,642 | 12,434 | 21,313 | 16,663 | 12,020 | 18,415 | 14,491 | 17,764 | 7,390 | 6,939 |
| 2019 | 2,989 | 2,039 | 7,480 | 20,531 | 26,410 | 22,391 | 20,219 | 12,489 | 15,977 | 15,875 | 6,716 | 4,189 |
| 2020 | 1,335 | 3,493 | 15,140 | 18,365 | 24,204 | 19,655 | 14,400 | 14,018 | 17,478 | 12,060 | 9,246 | 2,350 |
| 2021 | 1,426 | 5,888 | 11,110 | 17,188 | 26,852 | 19,670 | 15,791 | 14,056 | 18,554 | 15,642 | 6,916 | 6,255 |
| 2022 | 2,107 | 2,266 | 9,833 | 15,764 | 25,647 | 19,816 | 15,669 | 17,495 | 17,311 | 15,252 | 7,789 | 5,956 |
| 2023 | 6,140 | 5,718 | 6,562 | 11,252 | 24,093 | 21,500 | 13,029 | 9,655 | 13,570 | 14,677 | 8,257 | 5,348 |
| 2024 | 1,905 | |||||||||||
| - = No Data Reported; -- = Not Applicable; NA = Not Available; W = Withheld to avoid disclosure of individual company data. |
| Release Date: 3/29/2024 |
| Next Release Date: 4/30/2024 |