|
Download Data (XLS File) |
|
||||||||
|
||||||||
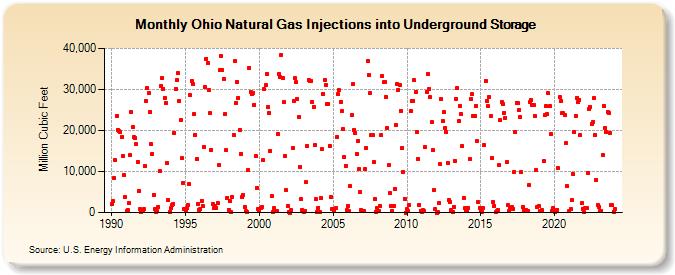
| Ohio Natural Gas Injections into Underground Storage (Million Cubic Feet) | ||||||||
| Year | Jan | Feb | Mar | Apr | May | Jun | Jul | Aug | Sep | Oct | Nov | Dec |
|---|---|---|---|---|---|---|---|---|---|---|---|---|
| 1990 | 2,095 | 2,783 | 8,487 | 12,731 | 23,624 | 20,221 | 19,895 | 19,615 | 18,355 | 13,780 | 9,089 | 3,777 |
| 1991 | 474 | 569 | 2,278 | 13,918 | 24,470 | 20,782 | 18,348 | 18,211 | 16,615 | 12,371 | 5,205 | 819 |
| 1992 | 46 | 383 | 775 | 11,319 | 27,233 | 30,305 | 29,147 | 24,617 | 16,672 | 14,358 | 4,364 | 790 |
| 1993 | 152 | 278 | 1,376 | 10,017 | 30,894 | 32,804 | 30,187 | 28,001 | 26,720 | 12,055 | 3,036 | 109 |
| 1994 | 1,075 | 1,772 | 2,164 | 19,428 | 30,107 | 32,303 | 33,898 | 27,173 | 22,437 | 13,196 | 7,269 | 837 |
| 1995 | 617 | 1,176 | 1,782 | 7,066 | 28,599 | 32,073 | 31,206 | 24,033 | 18,978 | 13,053 | 2,159 | 608 |
| 1996 | 826 | 2,927 | 1,712 | 16,095 | 30,586 | 37,488 | 36,425 | 29,901 | 24,140 | 15,350 | 2,100 | 1,091 |
| 1997 | 1,494 | 1,211 | 2,351 | 11,510 | 34,696 | 38,150 | 34,738 | 32,628 | 24,009 | 15,174 | 3,656 | 709 |
| 1998 | 2,828 | 28 | 3,903 | 18,901 | 36,848 | 26,778 | 31,932 | 27,955 | 20,229 | 14,338 | 3,833 | 4,257 |
| 1999 | 1,438 | 339 | 229 | 10,413 | 35,277 | 29,436 | 28,998 | 29,151 | 26,317 | 13,692 | 6,037 | 815 |
| 2000 | 322 | 1,205 | 1,249 | 12,810 | 30,000 | 31,014 | 33,823 | 25,667 | 24,330 | 15,046 | 4,006 | 257 |
| 2001 | 1,110 | 501 | 306 | 19,192 | 33,808 | 32,931 | 38,432 | 32,888 | 26,864 | 13,742 | 5,425 | 1,641 |
| 2002 | 198 | 1 | 598 | 15,698 | 27,121 | 32,712 | 31,802 | 27,720 | 23,308 | 11,172 | 3,213 | 633 |
| 2003 | 128 | 397 | 7,334 | 16,195 | 32,337 | 32,111 | 32,144 | 27,054 | 25,809 | 16,357 | 3,195 | 131 |
| 2004 | 1,219 | 86 | 3,566 | 15,420 | 28,913 | 32,237 | 31,057 | 26,438 | 26,535 | 16,321 | 3,775 | 746 |
| 2005 | 758 | 331 | 1,058 | 18,362 | 28,796 | 29,776 | 26,921 | 24,652 | 20,305 | 13,574 | 11,441 | 549 |
| 2006 | 1,567 | 291 | 6,466 | 23,691 | 31,215 | 20,117 | 19,475 | 14,312 | 17,424 | 10,507 | 4,940 | 603 |
| 2007 | 480 | 290 | 10,596 | 15,738 | 36,995 | 33,517 | 29,073 | 18,876 | 18,995 | 12,388 | 3,336 | 113 |
| 2008 | 1,015 | 363 | 1,638 | 18,790 | 33,176 | 31,698 | 31,772 | 28,253 | 20,562 | 11,511 | 4,684 | 1,633 |
| 2009 | 363 | 1,608 | 5,851 | 21,350 | 31,355 | 29,930 | 31,170 | 24,839 | 15,843 | 9,813 | 3,404 | 1 |
| 2010 | 785 | 413 | 1,753 | 24,644 | 27,159 | 27,243 | 32,218 | 29,418 | 19,675 | 13,053 | 1,924 | 461 |
| 2011 | 198 | 549 | 499 | 15,983 | 29,380 | 33,740 | 30,150 | 28,144 | 22,044 | 15,141 | 5,516 | 822 |
| 2012 | 7 | 40 | 2,390 | 11,902 | 27,629 | 22,324 | 24,394 | 20,620 | 19,600 | 12,080 | 3,014 | 2,554 |
| 2013 | 624 | 180 | 1,382 | 12,659 | 27,777 | 30,302 | 22,282 | 26,070 | 24,009 | 16,157 | 3,649 | 1,007 |
| 2014 | 377 | 624 | 1,115 | 13,051 | 27,762 | 28,823 | 23,535 | 23,421 | 26,057 | 17,355 | 2,536 | 1,219 |
| 2015 | 450 | 249 | 1,005 | 16,450 | 32,074 | 27,300 | 25,895 | 28,143 | 23,451 | 13,257 | 2,530 | 1,632 |
| 2016 | 70 | 260 | 706 | 11,545 | 22,461 | 26,893 | 26,559 | 24,316 | 23,141 | 12,241 | 1,801 | 436 |
| 2017 | 1,048 | 1,267 | 761 | 9,894 | 19,543 | 26,760 | 26,609 | 25,080 | 23,187 | 9,817 | 1,321 | 532 |
| 2018 | 683 | 624 | 368 | 6,698 | 26,930 | 27,391 | 26,276 | 26,268 | 23,480 | 10,419 | 1,358 | 1,617 |
| 2019 | 276 | 429 | 536 | 12,475 | 23,729 | 25,982 | 23,963 | 29,070 | 25,884 | 19,046 | 496 | 1,209 |
| 2020 | 23 | 267 | 706 | 10,783 | 28,086 | 27,268 | 24,195 | 24,143 | 23,751 | 16,876 | 6,427 | |
| 2021 | 426 | 894 | 3,040 | 9,360 | 19,695 | 23,636 | 27,945 | 26,861 | 27,495 | 18,790 | 2,237 | 968 |
| 2022 | 112 | 1,041 | 1,212 | 9,595 | 25,178 | 25,706 | 21,660 | 22,184 | 27,917 | 18,978 | 8,012 | 1,961 |
| 2023 | 1,466 | 422 | 488 | 14,042 | 26,083 | 20,720 | 19,639 | 24,568 | 24,279 | 19,464 | 1,795 | 1,833 |
| 2024 | 209 | |||||||||||
| - = No Data Reported; -- = Not Applicable; NA = Not Available; W = Withheld to avoid disclosure of individual company data. |
| Release Date: 3/29/2024 |
| Next Release Date: 4/30/2024 |