|
Download Data (XLS File) |
|
||||||||
|
||||||||
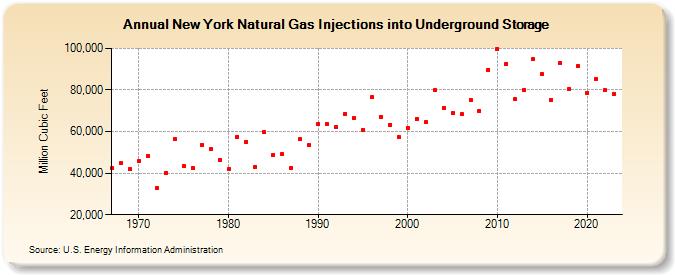
| New York Natural Gas Injections into Underground Storage (Million Cubic Feet) | ||||||||
| Decade | Year-0 | Year-1 | Year-2 | Year-3 | Year-4 | Year-5 | Year-6 | Year-7 | Year-8 | Year-9 |
|---|---|---|---|---|---|---|---|---|---|---|
| 1960's | 42,344 | 44,978 | 41,874 | |||||||
| 1970's | 45,802 | 48,026 | 32,777 | 40,277 | 56,403 | 43,207 | 42,565 | 53,768 | 51,620 | 46,439 |
| 1980's | 41,857 | 57,610 | 55,213 | 43,106 | 59,702 | 48,748 | 49,185 | 42,616 | 56,332 | 53,490 |
| 1990's | 63,690 | 63,411 | 62,265 | 68,532 | 66,627 | 60,947 | 76,475 | 67,135 | 63,298 | 57,442 |
| 2000's | 61,763 | 66,179 | 64,381 | 79,757 | 71,554 | 69,022 | 68,290 | 75,186 | 69,946 | 89,822 |
| 2010's | 99,802 | 92,660 | 75,635 | 79,917 | 94,858 | 87,575 | 75,233 | 93,013 | 80,521 | 91,709 |
| 2020's | 78,732 | 85,110 | 79,893 | 78,246 |
| - = No Data Reported; -- = Not Applicable; NA = Not Available; W = Withheld to avoid disclosure of individual company data. |
| Release Date: 3/29/2024 |
| Next Release Date: 4/30/2024 |