|
Download Data (XLS File) |
|
||||||||
|
||||||||
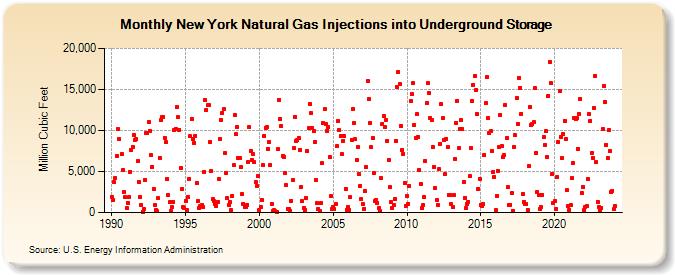
| New York Natural Gas Injections into Underground Storage (Million Cubic Feet) | ||||||||
| Year | Jan | Feb | Mar | Apr | May | Jun | Jul | Aug | Sep | Oct | Nov | Dec |
|---|---|---|---|---|---|---|---|---|---|---|---|---|
| 1990 | 1,869 | 1,563 | 3,711 | 4,231 | 6,916 | 10,157 | 8,932 | 7,141 | 5,172 | 2,549 | 1,879 | |
| 1991 | 539 | 1,202 | 1,845 | 5,002 | 7,611 | 7,983 | 9,509 | 8,881 | 8,960 | 6,263 | 3,702 | 1,915 |
| 1992 | 965 | 83 | 455 | 4,003 | 9,753 | 9,677 | 11,054 | 9,933 | 6,960 | 5,600 | 2,866 | 916 |
| 1993 | 367 | 155 | 1,728 | 6,690 | 11,220 | 11,597 | 11,643 | 9,116 | 8,556 | 4,134 | 2,100 | 1,227 |
| 1994 | 170 | 658 | 1,345 | 10,036 | 10,214 | 12,914 | 11,583 | 10,095 | 5,457 | 2,869 | 707 | 579 |
| 1995 | 1,439 | 287 | 1,939 | 4,147 | 9,279 | 11,454 | 8,979 | 8,492 | 9,378 | 3,586 | 1,390 | 577 |
| 1996 | 817 | 905 | 726 | 4,968 | 13,692 | 12,522 | 13,055 | 13,067 | 8,608 | 5,102 | 1,608 | 1,405 |
| 1997 | 1,071 | 795 | 1,332 | 4,122 | 9,018 | 11,299 | 12,161 | 12,572 | 7,252 | 4,820 | 1,743 | 949 |
| 1998 | 1,269 | 258 | 2,014 | 5,749 | 11,906 | 9,530 | 10,468 | 6,649 | 6,650 | 5,494 | 2,243 | 1,068 |
| 1999 | 696 | 704 | 981 | 6,138 | 10,395 | 7,486 | 6,442 | 7,094 | 6,108 | 3,691 | 3,240 | 4,468 |
| 2000 | 331 | 646 | 1,562 | 5,753 | 9,351 | 10,308 | 10,384 | 7,788 | 8,605 | 5,794 | 1,058 | 185 |
| 2001 | 272 | 141 | 86 | 7,686 | 13,729 | 11,419 | 10,560 | 6,892 | 6,792 | 4,800 | 3,320 | 483 |
| 2002 | 374 | 222 | 1,458 | 3,952 | 7,830 | 11,660 | 8,739 | 8,860 | 9,104 | 7,676 | 3,124 | 1,381 |
| 2003 | 611 | 292 | 1,782 | 7,524 | 10,286 | 13,269 | 12,086 | 10,243 | 9,962 | 8,631 | 3,914 | 1,157 |
| 2004 | 444 | 137 | 1,150 | 5,996 | 10,881 | 12,580 | 10,752 | 9,995 | 10,410 | 6,748 | 2,016 | 445 |
| 2005 | 666 | 404 | 1,027 | 8,055 | 11,163 | 10,006 | 9,327 | 7,080 | 8,762 | 9,270 | 2,891 | 370 |
| 2006 | 679 | 329 | 1,852 | 8,887 | 12,581 | 10,967 | 8,903 | 6,461 | 8,047 | 4,671 | 3,267 | 1,645 |
| 2007 | 1,043 | 439 | 2,598 | 5,542 | 16,028 | 13,798 | 10,956 | 7,935 | 9,135 | 4,789 | 1,434 | 1,490 |
| 2008 | 1,211 | 534 | 155 | 4,175 | 10,840 | 11,756 | 10,463 | 11,303 | 8,724 | 6,423 | 3,090 | 1,272 |
| 2009 | 557 | 900 | 1,647 | 8,758 | 15,340 | 17,151 | 15,677 | 10,569 | 7,628 | 7,193 | 3,586 | 815 |
| 2010 | 2,014 | 1,092 | 3,232 | 13,550 | 14,467 | 15,781 | 10,656 | 9,084 | 11,960 | 9,228 | 5,225 | 3,513 |
| 2011 | 609 | 865 | 1,892 | 6,300 | 13,329 | 15,733 | 14,607 | 11,511 | 11,239 | 7,985 | 5,603 | 2,986 |
| 2012 | 1,514 | 972 | 5,263 | 8,404 | 13,168 | 11,466 | 8,842 | 4,646 | 8,965 | 8,018 | 2,192 | 2,185 |
| 2013 | 1,045 | 676 | 2,126 | 6,559 | 10,944 | 13,616 | 7,822 | 10,164 | 11,218 | 10,155 | 3,770 | 1,822 |
| 2014 | 541 | 983 | 1,333 | 4,405 | 7,848 | 13,651 | 15,567 | 16,615 | 14,909 | 11,975 | 2,890 | 4,143 |
| 2015 | 952 | 769 | 1,036 | 7,014 | 13,316 | 16,474 | 11,517 | 9,712 | 9,916 | 7,498 | 4,981 | 4,390 |
| 2016 | 306 | 2,029 | 5,099 | 7,979 | 11,932 | 8,073 | 6,751 | 6,960 | 13,075 | 9,100 | 3,055 | 873 |
| 2017 | 963 | 2,344 | 224 | 8,020 | 9,414 | 13,960 | 10,843 | 16,432 | 15,219 | 12,016 | 2,234 | 1,344 |
| 2018 | 1,097 | 1,039 | 363 | 5,643 | 12,883 | 10,642 | 10,763 | 10,994 | 15,133 | 7,296 | 2,484 | 2,185 |
| 2019 | 447 | 666 | 2,163 | 9,247 | 8,288 | 9,884 | 6,777 | 14,214 | 18,347 | 15,740 | 4,723 | 1,214 |
| 2020 | 1,377 | 479 | 4,320 | 8,651 | 14,796 | 9,248 | 6,670 | 9,585 | 11,210 | 8,912 | 2,705 | 781 |
| 2021 | 347 | 904 | 4,168 | 6,078 | 11,503 | 11,424 | 11,459 | 7,788 | 12,024 | 13,879 | 2,366 | 3,170 |
| 2022 | 255 | 689 | 811 | 4,101 | 12,000 | 11,197 | 7,245 | 6,697 | 12,773 | 16,684 | 6,106 | 1,335 |
| 2023 | 732 | 302 | 610 | 10,124 | 15,425 | 13,474 | 8,289 | 6,667 | 10,014 | 7,486 | 2,459 | 2,665 |
| 2024 | 405 | |||||||||||
| - = No Data Reported; -- = Not Applicable; NA = Not Available; W = Withheld to avoid disclosure of individual company data. |
| Release Date: 3/29/2024 |
| Next Release Date: 4/30/2024 |