|
Download Data (XLS File) |
|
||||||||
|
||||||||
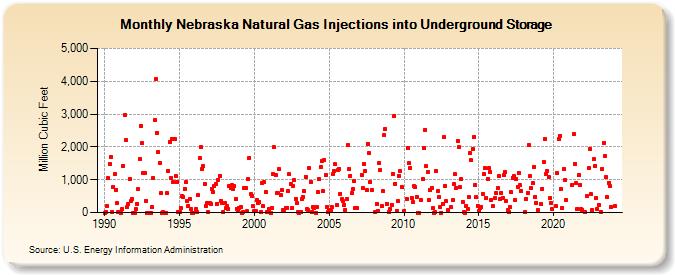
| Nebraska Natural Gas Injections into Underground Storage (Million Cubic Feet) | ||||||||
| Year | Jan | Feb | Mar | Apr | May | Jun | Jul | Aug | Sep | Oct | Nov | Dec |
|---|---|---|---|---|---|---|---|---|---|---|---|---|
| 1990 | 0 | 29 | 194 | 1,042 | 1,483 | 1,696 | 30 | 778 | 1,165 | 695 | 281 | 4 |
| 1991 | 5 | 0 | 112 | 1,421 | 2,977 | 2,197 | 163 | 265 | 1,023 | 340 | 412 | 0 |
| 1992 | 0 | 108 | 275 | 703 | 1,637 | 2,634 | 2,118 | 1,220 | 1,200 | 360 | 0 | 0 |
| 1993 | 0 | 0 | 162 | 1,050 | 2,814 | 4,060 | 2,435 | 1,851 | 1,518 | 586 | 0 | 10 |
| 1994 | 0 | 0 | 582 | 1,280 | 2,156 | 1,045 | 2,245 | 933 | 2,230 | 1,100 | 938 | 15 |
| 1995 | 27 | 148 | 490 | 478 | 727 | 920 | 346 | 207 | 408 | 120 | 0 | 0 |
| 1996 | - | 101 | 14 | 530 | 1,650 | 1,984 | 1,325 | 1,416 | 875 | 213 | 289 | 25 |
| 1997 | 302 | 267 | 721 | 615 | 796 | 885 | 271 | 1,005 | 1,123 | 367 | 300 | 6 |
| 1998 | 298 | 134 | 212 | 102 | 814 | 738 | 828 | 719 | 805 | 409 | 122 | 84 |
| 1999 | 128 | 162 | 1 | 21 | 758 | 759 | 35 | 1,008 | 1,673 | 551 | 512 | 193 |
| 2000 | 47 | 54 | 368 | 287 | 321 | 18 | 912 | 187 | 928 | 629 | 4 | 7 |
| 2001 | 96 | 0 | 133 | 1,177 | 1,985 | 1,135 | 596 | 587 | 1,317 | 532 | 677 | 68 |
| 2002 | 65 | 153 | 153 | 650 | 1,163 | 883 | 134 | 819 | 983 | 414 | 285 | 32 |
| 2003 | 0 | 18 | 417 | 478 | 647 | 1,097 | 98 | 84 | 1,352 | 940 | 27 | 176 |
| 2004 | 129 | 0 | 180 | 613 | 1,008 | 1,397 | 1,556 | 645 | 1,590 | 1,150 | 180 | 6 |
| 2005 | 77 | 76 | 162 | 1,168 | 1,260 | 1,465 | 231 | 1,299 | 1,340 | 579 | 404 | 351 |
| 2006 | 228 | 93 | 417 | 2,057 | 1,328 | 1,125 | 595 | 706 | 954 | 124 | 135 | |
| 2007 | 1,150 | 759 | 1,470 | 1,277 | 681 | 2,098 | 1,803 | 932 | 688 | |||
| 2008 | 9 | 272 | 62 | 1,513 | 1,292 | 198 | 642 | 2,351 | 2,545 | 270 | ||
| 2009 | 14 | 110 | 238 | 1,175 | 2,948 | 882 | 60 | 343 | 1,128 | 1,254 | 785 | |
| 2010 | 55 | 420 | 1,960 | 1,497 | 1,367 | 458 | 325 | 811 | 766 | 486 | 0 | |
| 2011 | 1 | 380 | 1,010 | 1,955 | 2,527 | 1,410 | 1,221 | 396 | 691 | 763 | 128 | |
| 2012 | 1 | 5 | 1,266 | 653 | 460 | 170 | 0 | 274 | 2,300 | 821 | 337 | 63 |
| 2013 | 168 | 371 | 858 | 1,162 | 742 | 2,178 | 1,982 | 764 | 1,024 | 328 | ||
| 2014 | 30 | 0 | 204 | 119 | 474 | 1,809 | 1,589 | 1,932 | 2,299 | 854 | 480 | 208 |
| 2015 | 39 | 127 | 182 | 569 | 1,161 | 1,343 | 442 | 1,037 | 1,354 | 1,230 | 387 | 188 |
| 2016 | 442 | 589 | 741 | 1,108 | 404 | 605 | 450 | 1,132 | 1,222 | 342 | 66 | |
| 2017 | 14 | 155 | 613 | 1,061 | 1,120 | 388 | 1,018 | 789 | 1,219 | 829 | 642 | |
| 2018 | 29 | 426 | 608 | 2,061 | 1,112 | 734 | 898 | 1,402 | 488 | 302 | 72 | |
| 2019 | 261 | 731 | 1,551 | 2,241 | 1,188 | 1,270 | 1,085 | 439 | 297 | 95 | ||
| 2020 | 197 | 1,202 | 2,232 | 2,341 | 712 | 151 | 1,340 | 988 | 386 | |||
| 2021 | 851 | 2,385 | 1,490 | 896 | 115 | 1,140 | 851 | 110 | 83 | |||
| 2022 | 13 | 503 | 1,346 | 1,946 | 553 | 81 | 1,622 | 1,424 | 442 | 111 | ||
| 2023 | 240 | 28 | 1,340 | 2,131 | 1,725 | 1,068 | 463 | 915 | 804 | 164 | ||
| - = No Data Reported; -- = Not Applicable; NA = Not Available; W = Withheld to avoid disclosure of individual company data. |
| Release Date: 3/29/2024 |
| Next Release Date: 4/30/2024 |