|
Download Data (XLS File) |
|
||||||||
|
||||||||
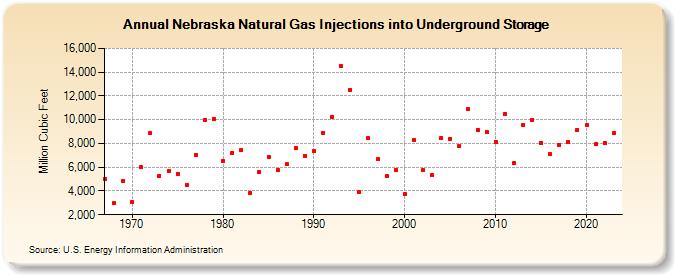
| Nebraska Natural Gas Injections into Underground Storage (Million Cubic Feet) | ||||||||
| Decade | Year-0 | Year-1 | Year-2 | Year-3 | Year-4 | Year-5 | Year-6 | Year-7 | Year-8 | Year-9 |
|---|---|---|---|---|---|---|---|---|---|---|
| 1960's | 5,012 | 2,959 | 4,838 | |||||||
| 1970's | 3,074 | 5,982 | 8,837 | 5,280 | 5,667 | 5,459 | 4,508 | 7,053 | 9,995 | 10,087 |
| 1980's | 6,557 | 7,198 | 7,455 | 3,869 | 5,628 | 6,848 | 5,748 | 6,241 | 7,615 | 6,952 |
| 1990's | 7,395 | 8,916 | 10,254 | 14,485 | 12,524 | 3,872 | 8,423 | 6,659 | 5,264 | 5,802 |
| 2000's | 3,763 | 8,303 | 5,735 | 5,334 | 8,454 | 8,412 | 7,760 | 10,860 | 9,155 | 8,936 |
| 2010's | 8,146 | 10,482 | 6,349 | 9,578 | 9,998 | 8,058 | 7,101 | 7,847 | 8,132 | 9,160 |
| 2020's | 9,551 | 7,919 | 8,042 | 8,878 |
| - = No Data Reported; -- = Not Applicable; NA = Not Available; W = Withheld to avoid disclosure of individual company data. |
| Release Date: 3/29/2024 |
| Next Release Date: 4/30/2024 |