|
Download Data (XLS File) |
|
||||||||
|
||||||||
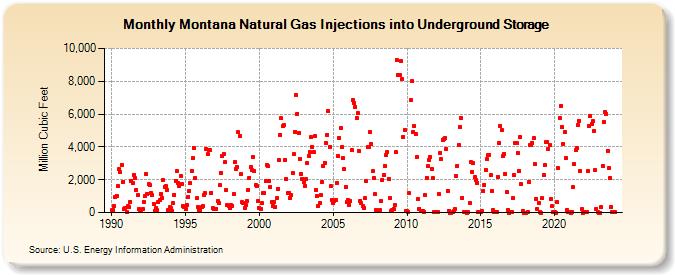
| Montana Natural Gas Injections into Underground Storage (Million Cubic Feet) | ||||||||
| Year | Jan | Feb | Mar | Apr | May | Jun | Jul | Aug | Sep | Oct | Nov | Dec |
|---|---|---|---|---|---|---|---|---|---|---|---|---|
| 1990 | 137 | 138 | 399 | 945 | 1,030 | 1,589 | 2,636 | 2,459 | 2,918 | 1,868 | 224 | 305 |
| 1991 | 49 | 400 | 337 | 661 | 1,912 | 1,830 | 2,316 | 2,077 | 1,390 | 1,069 | 208 | 144 |
| 1992 | 94 | 209 | 651 | 983 | 2,344 | 1,142 | 1,727 | 1,673 | 1,209 | 1,045 | 508 | 123 |
| 1993 | 282 | 135 | 618 | 768 | 1,156 | 889 | 1,969 | 1,580 | 1,608 | 1,404 | 175 | 310 |
| 1994 | 267 | 118 | 585 | 1,090 | 1,929 | 2,511 | 1,794 | 1,632 | 2,256 | 1,750 | 409 | 348 |
| 1995 | 225 | 467 | 966 | 1,330 | 1,775 | 2,542 | 3,316 | 3,925 | 2,132 | 871 | 325 | 180 |
| 1996 | 171 | 319 | 392 | 1,087 | 1,169 | 3,866 | 3,549 | 3,819 | 3,801 | 1,221 | 252 | 226 |
| 1997 | 222 | 247 | 690 | 576 | 1,682 | 2,428 | 3,439 | 3,589 | 3,057 | 1,389 | 468 | 430 |
| 1998 | 289 | 460 | 401 | 1,131 | 3,083 | 2,677 | 2,764 | 4,878 | 4,638 | 2,342 | 616 | 598 |
| 1999 | 288 | 431 | 710 | 1,397 | 2,127 | 2,768 | 2,604 | 3,391 | 2,502 | 1,681 | 1,608 | 724 |
| 2000 | 250 | 233 | 559 | 1,204 | 1,192 | 1,894 | 2,915 | 2,807 | 1,936 | 1,561 | 619 | 401 |
| 2001 | 667 | 324 | 869 | 1,460 | 3,215 | 4,732 | 5,736 | 5,250 | 5,307 | 3,206 | 2,047 | 1,184 |
| 2002 | 1,220 | 895 | 1,060 | 2,402 | 3,539 | 4,918 | 7,141 | 6,034 | 4,868 | 3,291 | 2,379 | 2,062 |
| 2003 | 1,889 | 1,621 | 2,023 | 3,032 | 3,464 | 3,707 | 4,578 | 3,992 | 3,704 | 4,645 | 1,391 | 1,035 |
| 2004 | 424 | 584 | 1,051 | 1,855 | 2,853 | 3,031 | 4,223 | 4,754 | 6,181 | 3,999 | 1,593 | 790 |
| 2005 | 580 | 717 | 754 | 1,794 | 3,418 | 4,564 | 5,150 | 3,981 | 3,316 | 2,624 | 1,582 | 639 |
| 2006 | 761 | 481 | 678 | 3,793 | 6,835 | 6,686 | 6,452 | 5,749 | 6,035 | 3,743 | 729 | 552 |
| 2007 | 420 | 308 | 873 | 1,916 | 3,991 | 3,988 | 4,878 | 4,205 | 2,516 | 2,130 | 1,114 | 172 |
| 2008 | 87 | 79 | 135 | 704 | 2,013 | 2,281 | 2,837 | 3,484 | 3,700 | 2,067 | 910 | 97 |
| 2009 | 137 | 239 | 444 | 3,670 | 9,273 | 8,393 | 8,385 | 9,213 | 8,114 | 4,623 | 5,030 | 110 |
| 2010 | 67 | 53 | 1,162 | 6,839 | 7,988 | 4,925 | 5,277 | 4,758 | 3,359 | 827 | 245 | 75 |
| 2011 | 82 | 68 | 39 | 1,054 | 2,130 | 2,821 | 3,210 | 3,391 | 2,649 | 2,077 | 44 | 17 |
| 2012 | 8 | 7 | 1,125 | 3,649 | 3,243 | 4,436 | 4,462 | 4,550 | 3,876 | 1,338 | 118 | 2 |
| 2013 | 2 | 5 | 79 | 197 | 2,241 | 2,843 | 4,129 | 5,214 | 5,735 | 912 | 50 | 18 |
| 2014 | 18 | 0 | 5 | 612 | 3,061 | 2,486 | 2,990 | 2,196 | 1,999 | 1,827 | 60 | 37 |
| 2015 | 42 | 90 | 1,320 | 1,698 | 2,621 | 3,257 | 3,487 | 3,535 | 2,260 | 1,313 | 153 | 50 |
| 2016 | 12 | 55 | 2,188 | 4,224 | 5,294 | 5,020 | 3,433 | 3,586 | 2,366 | 1,228 | 166 | 1 |
| 2017 | 6 | 43 | 878 | 2,270 | 4,247 | 4,260 | 3,647 | 2,552 | 4,599 | 1,724 | 114 | 0 |
| 2018 | 0 | 3 | 39 | 1,875 | 4,140 | 4,110 | 4,239 | 4,539 | 2,954 | 852 | 211 | 592 |
| 2019 | 45 | 0 | 858 | 2,278 | 2,879 | 4,298 | 4,285 | 3,897 | 4,090 | 838 | 382 | 4 |
| 2020 | 6 | 2 | 626 | 2,690 | 5,749 | 6,493 | 5,219 | 4,178 | 4,915 | 3,309 | 152 | 4 |
| 2021 | 4 | 1 | 34 | 1,552 | 2,956 | 3,781 | 3,951 | 5,307 | 5,584 | 2,538 | 192 | 3 |
| 2022 | 4 | 8 | 64 | 2,519 | 5,273 | 5,912 | 5,374 | 5,550 | 4,989 | 2,577 | 240 | 5 |
| 2023 | 2 | 2 | 317 | 2,850 | 5,521 | 6,107 | 6,020 | 3,754 | 2,727 | 2,106 | 336 | 15 |
| 2024 | 24 | 8 | ||||||||||
| - = No Data Reported; -- = Not Applicable; NA = Not Available; W = Withheld to avoid disclosure of individual company data. |
| Release Date: 4/30/2024 |
| Next Release Date: 5/31/2024 |