|
Download Data (XLS File) |
|
||||||||
|
||||||||
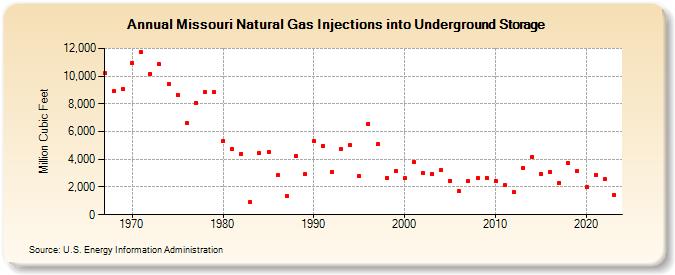
| Missouri Natural Gas Injections into Underground Storage (Million Cubic Feet) | ||||||||
| Decade | Year-0 | Year-1 | Year-2 | Year-3 | Year-4 | Year-5 | Year-6 | Year-7 | Year-8 | Year-9 |
|---|---|---|---|---|---|---|---|---|---|---|
| 1960's | 10,206 | 8,919 | 9,044 | |||||||
| 1970's | 10,957 | 11,741 | 10,188 | 10,847 | 9,413 | 8,658 | 6,634 | 8,074 | 8,836 | 8,836 |
| 1980's | 5,305 | 4,727 | 4,407 | 924 | 4,431 | 4,537 | 2,835 | 1,337 | 4,240 | 2,911 |
| 1990's | 5,316 | 4,972 | 3,080 | 4,711 | 4,997 | 2,777 | 6,570 | 5,081 | 2,670 | 3,159 |
| 2000's | 2,619 | 3,794 | 2,977 | 2,963 | 3,213 | 2,455 | 1,689 | 2,423 | 2,634 | 2,684 |
| 2010's | 2,437 | 2,114 | 1,647 | 3,388 | 4,188 | 2,973 | 3,102 | 2,293 | 3,710 | 3,159 |
| 2020's | 1,969 | 2,885 | 2,573 | 1,455 |
| - = No Data Reported; -- = Not Applicable; NA = Not Available; W = Withheld to avoid disclosure of individual company data. |
| Release Date: 3/29/2024 |
| Next Release Date: 4/30/2024 |