|
Download Data (XLS File) |
|
||||||||
|
||||||||
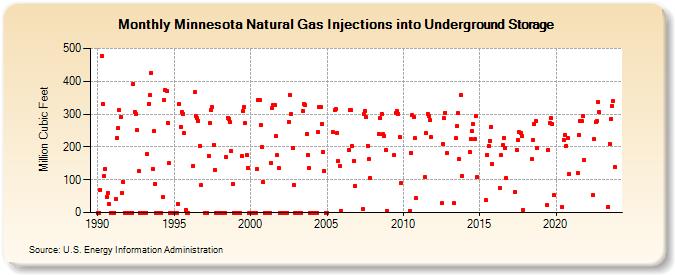
| Minnesota Natural Gas Injections into Underground Storage (Million Cubic Feet) | ||||||||
| Year | Jan | Feb | Mar | Apr | May | Jun | Jul | Aug | Sep | Oct | Nov | Dec |
|---|---|---|---|---|---|---|---|---|---|---|---|---|
| 1990 | 0 | 0 | 69 | 477 | 330 | 112 | 133 | 48 | 61 | 27 | 0 | 0 |
| 1991 | 0 | 0 | 42 | 228 | 257 | 312 | 291 | 61 | 93 | 0 | 0 | 0 |
| 1992 | 0 | 0 | 0 | 0 | 391 | 307 | 299 | 250 | 126 | 0 | 0 | 0 |
| 1993 | 0 | 0 | 0 | 178 | 331 | 358 | 426 | 134 | 248 | 87 | 0 | 0 |
| 1994 | 0 | 0 | 0 | 46 | 342 | 374 | 371 | 273 | 150 | 0 | 0 | 0 |
| 1995 | 0 | 0 | 0 | 27 | 331 | 262 | 306 | 301 | 241 | 9 | 0 | 0 |
| 1996 | - | - | - | 142 | 366 | 294 | 287 | 280 | 202 | 83 | - | - |
| 1997 | 0 | 0 | 0 | 173 | 273 | 312 | 321 | 207 | 130 | 0 | 0 | 0 |
| 1998 | 0 | 0 | 0 | 0 | 0 | 169 | 289 | 284 | 275 | 187 | 87 | 0 |
| 1999 | 0 | 0 | 0 | 0 | 0 | 172 | 308 | 320 | 272 | 175 | 136 | 0 |
| 2000 | 0 | 0 | 0 | 0 | 0 | 132 | 343 | 343 | 266 | 199 | 92 | 0 |
| 2001 | 0 | 0 | 0 | 0 | 152 | 319 | 329 | 329 | 232 | 174 | 135 | 0 |
| 2002 | 0 | 0 | 0 | 0 | 0 | 0 | 277 | 359 | 300 | 198 | 85 | 0 |
| 2003 | 0 | 0 | 0 | 0 | 0 | 309 | 331 | 329 | 239 | 176 | 135 | 0 |
| 2004 | 0 | 0 | 0 | 0 | 0 | 245 | 321 | 321 | 271 | 184 | 128 | 0 |
| 2005 | 0 | 244 | 311 | 314 | 243 | 157 | 143 | 6 | ||||
| 2006 | 191 | 311 | 312 | 202 | 158 | 82 | ||||||
| 2007 | 10 | 300 | 310 | 290 | 204 | 163 | 105 | |||||
| 2008 | 238 | 287 | 301 | 238 | 233 | 190 | 6 | |||||
| 2009 | 174 | 302 | 309 | 301 | 229 | 89 | ||||||
| 2010 | 6 | 182 | 296 | 292 | 226 | 43 | ||||||
| 2011 | 108 | 242 | 301 | 293 | 281 | 229 | ||||||
| 2012 | 28 | 210 | 287 | 304 | 180 | |||||||
| 2013 | 28 | 226 | 263 | 302 | 162 | 358 | 112 | |||||
| 2014 | 184 | 225 | 247 | 269 | 223 | 294 | 107 | |||||
| 2015 | 37 | 176 | 202 | 219 | 262 | 149 | ||||||
| 2016 | 76 | 174 | 205 | 228 | 197 | 104 | ||||||
| 2017 | 63 | 190 | 220 | 244 | 242 | 232 | 9 | |||||
| 2018 | 162 | 221 | 269 | 279 | 196 | |||||||
| 2019 | 23 | 192 | 273 | 288 | 270 | 52 | ||||||
| 2020 | 17 | 221 | 236 | 203 | 228 | 118 | ||||||
| 2021 | 120 | 237 | 278 | 279 | 293 | 160 | ||||||
| 2022 | 52 | 223 | 275 | 279 | 337 | 306 | ||||||
| 2023 | 17 | 210 | 285 | 325 | 339 | 138 | ||||||
| - = No Data Reported; -- = Not Applicable; NA = Not Available; W = Withheld to avoid disclosure of individual company data. |
| Release Date: 8/30/2024 |
| Next Release Date: 9/30/2024 |