|
Download Data (XLS File) |
|
||||||||
|
||||||||
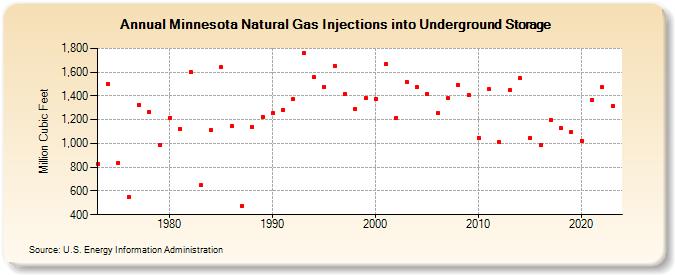
| Minnesota Natural Gas Injections into Underground Storage (Million Cubic Feet) | ||||||||
| Decade | Year-0 | Year-1 | Year-2 | Year-3 | Year-4 | Year-5 | Year-6 | Year-7 | Year-8 | Year-9 |
|---|---|---|---|---|---|---|---|---|---|---|
| 1970's | 829 | 1,502 | 839 | 551 | 1,326 | 1,267 | 987 | |||
| 1980's | 1,217 | 1,125 | 1,601 | 646 | 1,113 | 1,640 | 1,146 | 476 | 1,142 | 1,226 |
| 1990's | 1,256 | 1,285 | 1,372 | 1,762 | 1,556 | 1,478 | 1,655 | 1,417 | 1,291 | 1,384 |
| 2000's | 1,375 | 1,669 | 1,218 | 1,521 | 1,471 | 1,418 | 1,255 | 1,380 | 1,493 | 1,405 |
| 2010's | 1,046 | 1,454 | 1,010 | 1,451 | 1,549 | 1,044 | 984 | 1,199 | 1,127 | 1,099 |
| 2020's | 1,023 | 1,368 | 1,471 | 1,314 |
| - = No Data Reported; -- = Not Applicable; NA = Not Available; W = Withheld to avoid disclosure of individual company data. |
| Release Date: 3/29/2024 |
| Next Release Date: 4/30/2024 |