|
Download Data (XLS File) |
|
||||||||
|
||||||||
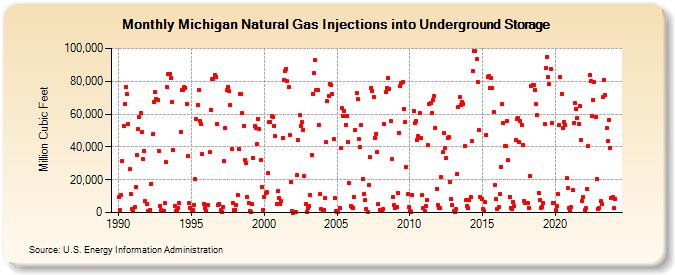
| Michigan Natural Gas Injections into Underground Storage (Million Cubic Feet) | ||||||||
| Year | Jan | Feb | Mar | Apr | May | Jun | Jul | Aug | Sep | Oct | Nov | Dec |
|---|---|---|---|---|---|---|---|---|---|---|---|---|
| 1990 | 9,245 | 1,582 | 10,686 | 31,603 | 52,870 | 66,300 | 76,718 | 72,178 | 53,824 | 26,587 | 11,504 | 2,212 |
| 1991 | 1,032 | 3,107 | 15,520 | 34,937 | 50,769 | 57,972 | 60,903 | 49,098 | 32,321 | 37,468 | 6,791 | 5,078 |
| 1992 | 1,016 | 711 | 1,745 | 17,659 | 47,567 | 67,131 | 73,573 | 69,301 | 68,599 | 37,430 | 3,947 | 1,784 |
| 1993 | 940 | 824 | 5,731 | 30,848 | 76,196 | 84,210 | 84,659 | 82,086 | 67,557 | 38,106 | 4,009 | 1,148 |
| 1994 | 1,753 | 2,710 | 5,746 | 48,993 | 74,457 | 74,862 | 76,199 | 76,055 | 66,415 | 34,456 | 5,582 | 2,992 |
| 1995 | 666 | 1,317 | 4,527 | 20,268 | 56,904 | 65,706 | 74,814 | 55,744 | 53,653 | 35,626 | 5,258 | 2,636 |
| 1996 | 1,157 | 4,836 | 4,674 | 36,617 | 62,629 | 81,128 | 81,412 | 83,999 | 82,870 | 53,744 | 4,847 | 5,224 |
| 1997 | 1,378 | 373 | 3,269 | 31,296 | 51,516 | 74,511 | 76,684 | 73,747 | 65,815 | 38,858 | 5,884 | 1,319 |
| 1998 | 1,811 | 4,454 | 10,813 | 38,692 | 72,334 | 72,289 | 60,571 | 52,660 | 31,748 | 30,159 | 9,781 | 5,727 |
| 1999 | 1,033 | 415 | 5,250 | 33,358 | 52,463 | 51,494 | 41,815 | 57,184 | 51,011 | 32,309 | 15,607 | 1,736 |
| 2000 | 9,214 | 12,034 | 12,233 | 23,846 | 55,302 | 55,167 | 58,696 | 58,122 | 52,732 | 46,462 | 5,454 | 12,889 |
| 2001 | 8,905 | 5,450 | 6,766 | 45,651 | 81,005 | 85,947 | 87,559 | 79,891 | 76,255 | 46,960 | 18,717 | 774 |
| 2002 | 5 | 72 | 575 | 22,612 | 43,956 | 59,264 | 52,633 | 55,050 | 50,353 | 22,103 | 5,227 | 497 |
| 2003 | 3,021 | 3,859 | 10,864 | 34,938 | 72,439 | 84,789 | 92,782 | 74,711 | 74,673 | 53,410 | 11,314 | 2,436 |
| 2004 | 702 | 1,847 | 8,626 | 42,716 | 67,799 | 71,277 | 78,526 | 77,644 | 72,016 | 44,669 | 8,676 | 926 |
| 2005 | 130 | 96 | 2,795 | 39,624 | 63,626 | 58,808 | 61,935 | 53,479 | 58,733 | 43,167 | 17,947 | 3,919 |
| 2006 | 3,600 | 3,044 | 9,616 | 50,528 | 72,956 | 68,967 | 44,611 | 40,178 | 53,249 | 20,602 | 11,217 | 7,639 |
| 2007 | 2,270 | 611 | 16,826 | 33,758 | 75,687 | 74,014 | 70,229 | 45,545 | 47,852 | 36,698 | 5,420 | 1,513 |
| 2008 | 1,825 | 749 | 2,092 | 53,642 | 73,138 | 75,943 | 82,243 | 75,436 | 55,631 | 32,359 | 9,649 | 4,881 |
| 2009 | 2,827 | 3,212 | 12,072 | 48,476 | 76,810 | 78,890 | 79,555 | 63,194 | 55,193 | 27,511 | 11,101 | 3,183 |
| 2010 | 1,084 | 362 | 10,868 | 61,699 | 54,259 | 55,479 | 44,234 | 46,397 | 60,621 | 45,536 | 10,643 | 2,633 |
| 2011 | 810 | 3,790 | 7,612 | 40,955 | 65,973 | 66,882 | 60,729 | 68,461 | 70,924 | 51,683 | 14,575 | 4,846 |
| 2012 | 2,550 | 2,615 | 21,453 | 36,845 | 48,178 | 39,592 | 33,514 | 45,661 | 45,806 | 18,842 | 8,141 | 4,751 |
| 2013 | 1,081 | 477 | 2,284 | 23,661 | 64,578 | 70,519 | 65,726 | 67,596 | 66,385 | 40,505 | 7,352 | 4,008 |
| 2014 | 2,642 | 7,686 | 9,464 | 43,718 | 86,333 | 98,593 | 98,209 | 93,241 | 79,338 | 50,027 | 9,608 | 8,314 |
| 2015 | 2,204 | 1,106 | 6,257 | 47,423 | 82,674 | 82,983 | 76,118 | 81,978 | 75,748 | 61,449 | 16,963 | 8,301 |
| 2016 | 2,018 | 3,532 | 11,221 | 27,911 | 66,310 | 54,263 | 40,342 | 40,334 | 55,690 | 31,831 | 9,639 | 2,575 |
| 2017 | 2,267 | 6,540 | 4,003 | 44,070 | 57,076 | 57,797 | 42,720 | 55,743 | 53,389 | 41,313 | 7,199 | 5,557 |
| 2018 | 5,698 | 5,774 | 2,992 | 22,533 | 77,128 | 77,860 | 77,681 | 74,724 | 65,910 | 59,184 | 12,166 | 7,577 |
| 2019 | 3,042 | 3,679 | 5,806 | 53,794 | 88,247 | 95,040 | 82,282 | 78,098 | 87,148 | 54,398 | 5,719 | 5,689 |
| 2020 | 1,554 | 3,738 | 11,088 | 53,031 | 82,604 | 72,424 | 51,356 | 55,301 | 53,220 | 20,767 | 15,051 | 2,652 |
| 2021 | 990 | 3,295 | 13,465 | 54,720 | 66,440 | 63,286 | 57,620 | 54,175 | 64,753 | 44,423 | 7,073 | 9,686 |
| 2022 | 1,379 | 2,688 | 14,589 | 40,497 | 83,828 | 80,036 | 58,986 | 68,402 | 79,322 | 58,335 | 20,178 | 2,463 |
| 2023 | 3,018 | 6,760 | 5,103 | 70,191 | 81,034 | 71,381 | 51,357 | 43,334 | 56,574 | 39,259 | 8,667 | 9,265 |
| 2024 | 2,941 | |||||||||||
| - = No Data Reported; -- = Not Applicable; NA = Not Available; W = Withheld to avoid disclosure of individual company data. |
| Release Date: 3/29/2024 |
| Next Release Date: 4/30/2024 |