|
Download Data (XLS File) |
|
||||||||
|
||||||||
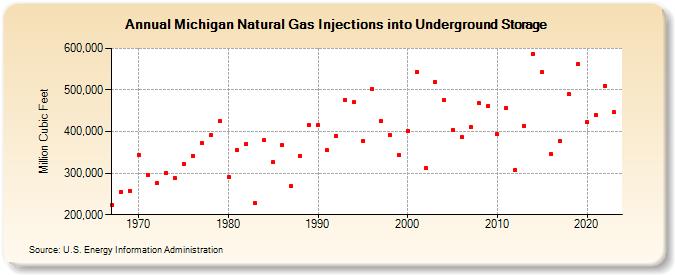
| Michigan Natural Gas Injections into Underground Storage (Million Cubic Feet) | ||||||||
| Decade | Year-0 | Year-1 | Year-2 | Year-3 | Year-4 | Year-5 | Year-6 | Year-7 | Year-8 | Year-9 |
|---|---|---|---|---|---|---|---|---|---|---|
| 1960's | 222,800 | 255,365 | 257,737 | |||||||
| 1970's | 344,524 | 296,475 | 275,460 | 299,766 | 287,776 | 322,960 | 342,010 | 372,262 | 390,610 | 424,176 |
| 1980's | 290,497 | 354,911 | 371,216 | 227,107 | 379,036 | 325,729 | 366,672 | 268,325 | 341,649 | 414,819 |
| 1990's | 415,309 | 354,996 | 390,465 | 476,312 | 470,220 | 377,121 | 503,138 | 424,651 | 391,041 | 343,675 |
| 2000's | 402,150 | 543,881 | 312,348 | 519,235 | 475,423 | 404,258 | 386,208 | 410,421 | 467,589 | 462,022 |
| 2010's | 393,814 | 457,240 | 307,948 | 414,172 | 587,171 | 543,203 | 345,667 | 377,675 | 489,229 | 562,941 |
| 2020's | 422,786 | 439,928 | 510,703 | 445,941 |
| - = No Data Reported; -- = Not Applicable; NA = Not Available; W = Withheld to avoid disclosure of individual company data. |
| Release Date: 3/29/2024 |
| Next Release Date: 4/30/2024 |