|
Download Data (XLS File) |
|
||||||||
|
||||||||
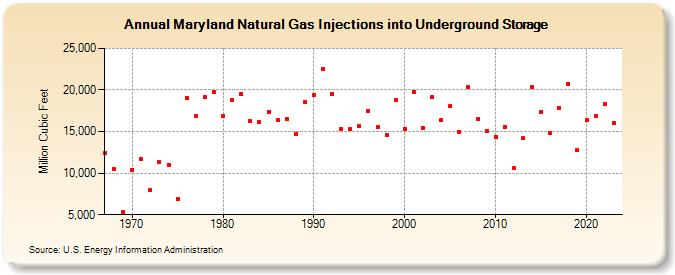
| Maryland Natural Gas Injections into Underground Storage (Million Cubic Feet) | ||||||||
| Decade | Year-0 | Year-1 | Year-2 | Year-3 | Year-4 | Year-5 | Year-6 | Year-7 | Year-8 | Year-9 |
|---|---|---|---|---|---|---|---|---|---|---|
| 1960's | 12,465 | 10,520 | 5,281 | |||||||
| 1970's | 10,421 | 11,746 | 7,920 | 11,328 | 11,016 | 6,830 | 19,012 | 16,820 | 19,121 | 19,715 |
| 1980's | 16,907 | 18,753 | 19,476 | 16,298 | 16,154 | 17,362 | 16,330 | 16,539 | 14,653 | 18,548 |
| 1990's | 19,431 | 22,508 | 19,502 | 15,314 | 15,316 | 15,610 | 17,448 | 15,510 | 14,627 | 18,802 |
| 2000's | 15,341 | 19,786 | 15,445 | 19,166 | 16,347 | 18,026 | 14,947 | 20,309 | 16,517 | 15,088 |
| 2010's | 14,384 | 15,592 | 10,582 | 14,165 | 20,362 | 17,373 | 14,854 | 17,815 | 20,772 | 12,728 |
| 2020's | 16,392 | 16,922 | 18,263 | 16,043 |
| - = No Data Reported; -- = Not Applicable; NA = Not Available; W = Withheld to avoid disclosure of individual company data. |
| Release Date: 3/29/2024 |
| Next Release Date: 4/30/2024 |