|
Download Data (XLS File) |
|
||||||||
|
||||||||
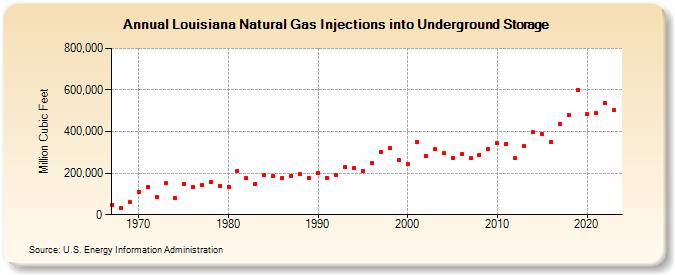
| Louisiana Natural Gas Injections into Underground Storage (Million Cubic Feet) | ||||||||
| Decade | Year-0 | Year-1 | Year-2 | Year-3 | Year-4 | Year-5 | Year-6 | Year-7 | Year-8 | Year-9 |
|---|---|---|---|---|---|---|---|---|---|---|
| 1960's | 47,474 | 33,037 | 58,753 | |||||||
| 1970's | 110,680 | 132,263 | 84,201 | 151,287 | 81,960 | 149,966 | 132,724 | 144,053 | 155,450 | 140,433 |
| 1980's | 134,386 | 212,267 | 177,194 | 148,679 | 193,096 | 184,351 | 174,222 | 188,110 | 194,251 | 178,222 |
| 1990's | 200,183 | 178,002 | 193,051 | 229,568 | 224,525 | 209,575 | 249,153 | 302,324 | 321,681 | 261,763 |
| 2000's | 242,566 | 351,853 | 282,824 | 314,609 | 296,365 | 273,161 | 291,259 | 272,581 | 287,449 | 315,872 |
| 2010's | 343,090 | 342,092 | 270,858 | 328,452 | 396,597 | 389,137 | 350,974 | 437,422 | 480,137 | 600,033 |
| 2020's | 482,581 | 487,801 | 536,378 | 503,002 |
| - = No Data Reported; -- = Not Applicable; NA = Not Available; W = Withheld to avoid disclosure of individual company data. |
| Release Date: 3/29/2024 |
| Next Release Date: 4/30/2024 |