|
Download Data (XLS File) |
|
||||||||
|
||||||||
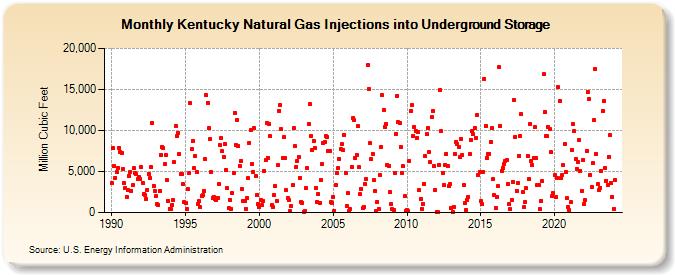
| Kentucky Natural Gas Injections into Underground Storage (Million Cubic Feet) | ||||||||
| Year | Jan | Feb | Mar | Apr | May | Jun | Jul | Aug | Sep | Oct | Nov | Dec |
|---|---|---|---|---|---|---|---|---|---|---|---|---|
| 1990 | 3,591 | 7,852 | 5,644 | 4,269 | 4,991 | 5,462 | 7,829 | 7,379 | 7,268 | 5,324 | 3,591 | 2,996 |
| 1991 | 1,910 | 2,777 | 4,468 | 4,883 | 2,671 | 3,345 | 5,395 | 4,818 | 4,660 | 4,074 | 4,315 | 4,110 |
| 1992 | 5,509 | 3,635 | 2,314 | 2,151 | 1,697 | 2,787 | 4,724 | 4,202 | 5,539 | 10,882 | 3,272 | 2,656 |
| 1993 | 1,967 | 990 | 928 | 2,687 | 7,049 | 7,985 | 7,838 | 5,873 | 7,014 | 3,907 | 1,397 | 482 |
| 1994 | 431 | 928 | 1,526 | 6,100 | 10,571 | 9,346 | 9,742 | 7,138 | 4,696 | 4,684 | 3,438 | 1,230 |
| 1995 | 1,189 | 478 | 2,868 | 4,780 | 13,288 | 7,749 | 8,687 | 5,375 | 6,889 | 4,882 | 1,009 | 1,369 |
| 1996 | 625 | 2,061 | 2,137 | 2,635 | 6,489 | 14,262 | 13,389 | 10,275 | 8,975 | 4,913 | 1,788 | 1,948 |
| 1997 | 1,674 | 1,585 | 1,826 | 3,461 | 8,209 | 9,043 | 7,464 | 6,799 | 8,296 | 5,231 | 2,932 | 553 |
| 1998 | 1,576 | 476 | 2,328 | 4,821 | 12,161 | 8,211 | 11,315 | 8,081 | 5,674 | 6,320 | 2,892 | 1,410 |
| 1999 | 1,431 | 485 | 1,727 | 4,174 | 8,519 | 10,019 | 5,907 | 4,948 | 10,243 | 4,449 | 2,160 | 1,070 |
| 2000 | 649 | 1,574 | 899 | 1,452 | 5,105 | 6,358 | 10,918 | 6,686 | 10,831 | 9,325 | 914 | 638 |
| 2001 | 2,190 | 3,204 | 1,456 | 5,756 | 12,382 | 13,082 | 10,140 | 6,637 | 9,184 | 6,663 | 2,715 | 1,757 |
| 2002 | 1,489 | 153 | 828 | 3,323 | 10,264 | 8,068 | 5,595 | 6,288 | 6,773 | 4,271 | 1,316 | 1,209 |
| 2003 | 99 | 137 | 3,002 | 5,378 | 10,760 | 13,171 | 9,310 | 7,647 | 8,752 | 7,880 | 3,052 | 1,309 |
| 2004 | 2,254 | 1,208 | 3,950 | 5,865 | 8,438 | 8,565 | 9,302 | 9,201 | 7,450 | 7,446 | 1,244 | 1,116 |
| 2005 | 1,928 | 232 | 3,385 | 4,821 | 5,402 | 6,574 | 7,709 | 8,308 | 7,638 | 9,502 | 4,866 | 825 |
| 2006 | 2,333 | 249 | 387 | 5,563 | 11,472 | 11,253 | 6,621 | 6,992 | 10,496 | 5,507 | 2,236 | 2,846 |
| 2007 | 512 | 672 | 3,494 | 4,078 | 17,943 | 15,069 | 8,440 | 6,503 | 7,188 | 3,978 | 2,638 | 167 |
| 2008 | 1,341 | 455 | 4,577 | 8,042 | 14,277 | 12,515 | 10,459 | 10,778 | 5,827 | 5,726 | 2,517 | 990 |
| 2009 | 422 | 255 | 4,849 | 9,602 | 14,255 | 10,975 | 10,964 | 7,996 | 4,849 | 5,619 | 1,963 | 224 |
| 2010 | 362 | 216 | 6,279 | 12,329 | 13,084 | 9,337 | 10,414 | 9,924 | 9,107 | 9,785 | 2,704 | 1,626 |
| 2011 | 463 | 1,063 | 3,491 | 6,848 | 9,518 | 10,279 | 7,325 | 6,149 | 11,603 | 12,393 | 5,639 | 2,755 |
| 2012 | 128 | 68 | 5,826 | 14,916 | 9,903 | 4,875 | 3,367 | 5,825 | 7,188 | 5,724 | 3,190 | 3,473 |
| 2013 | 556 | 33 | 731 | 7,141 | 8,637 | 8,401 | 7,987 | 6,804 | 8,982 | 7,024 | 3,374 | 1,113 |
| 2014 | 357 | 1,515 | 1,948 | 7,149 | 8,864 | 9,895 | 9,534 | 10,302 | 9,098 | 11,940 | 4,578 | 4,949 |
| 2015 | 1,388 | 987 | 4,982 | 16,269 | 10,535 | 6,641 | 7,168 | 7,173 | 8,646 | 10,282 | 4,072 | 2,105 |
| 2016 | 575 | 1,883 | 3,203 | 17,718 | 10,554 | 5,041 | 5,405 | 5,910 | 6,313 | 6,408 | 3,517 | 999 |
| 2017 | 390 | 1,531 | 3,756 | 13,769 | 9,245 | 2,667 | 3,635 | 6,947 | 9,310 | 11,958 | 2,500 | 666 |
| 2018 | 1,314 | 2,943 | 6,875 | 4,063 | 10,825 | 6,333 | 5,766 | 6,644 | 10,402 | 6,639 | 3,347 | 3,351 |
| 2019 | 420 | 1,449 | 3,826 | 16,863 | 12,296 | 9,362 | 9,278 | 10,433 | 10,129 | 7,336 | 2,017 | 2,372 |
| 2020 | 4,541 | 1,925 | 4,263 | 15,249 | 13,584 | 4,200 | 4,527 | 5,736 | 8,355 | 4,935 | 1,746 | 676 |
| 2021 | 263 | 1,226 | 7,650 | 10,745 | 9,879 | 6,493 | 5,366 | 6,197 | 8,818 | 5,107 | 2,657 | 6,423 |
| 2022 | 1,103 | 1,481 | 7,517 | 14,676 | 13,867 | 4,575 | 3,073 | 5,994 | 11,277 | 17,469 | 7,121 | 3,431 |
| 2023 | 2,737 | 3,040 | 5,089 | 12,420 | 13,580 | 5,439 | 3,876 | 3,371 | 6,800 | 9,408 | 3,618 | 1,931 |
| 2024 | 476 | |||||||||||
| - = No Data Reported; -- = Not Applicable; NA = Not Available; W = Withheld to avoid disclosure of individual company data. |
| Release Date: 3/29/2024 |
| Next Release Date: 4/30/2024 |