|
Download Data (XLS File) |
|
||||||||
|
||||||||
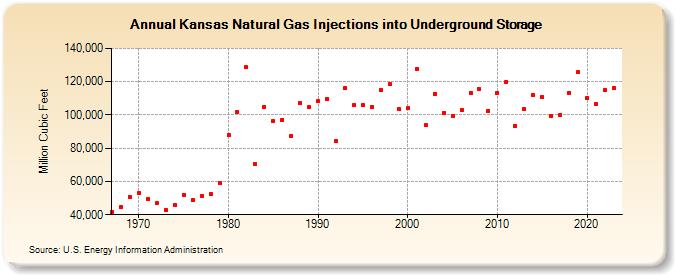
| Kansas Natural Gas Injections into Underground Storage (Million Cubic Feet) | ||||||||
| Decade | Year-0 | Year-1 | Year-2 | Year-3 | Year-4 | Year-5 | Year-6 | Year-7 | Year-8 | Year-9 |
|---|---|---|---|---|---|---|---|---|---|---|
| 1960's | 41,661 | 44,524 | 50,772 | |||||||
| 1970's | 52,966 | 49,267 | 46,810 | 42,910 | 45,642 | 52,045 | 48,582 | 51,344 | 52,242 | 59,148 |
| 1980's | 87,788 | 101,892 | 128,737 | 70,412 | 104,782 | 96,153 | 97,214 | 87,570 | 107,182 | 104,735 |
| 1990's | 108,143 | 109,627 | 84,249 | 116,284 | 106,069 | 105,693 | 104,871 | 114,848 | 118,404 | 103,396 |
| 2000's | 104,007 | 127,342 | 93,675 | 112,643 | 101,386 | 99,621 | 103,105 | 113,399 | 115,669 | 102,406 |
| 2010's | 113,253 | 119,823 | 93,460 | 103,676 | 111,853 | 110,950 | 99,581 | 100,227 | 113,446 | 125,725 |
| 2020's | 110,464 | 106,830 | 115,114 | 116,095 |
| - = No Data Reported; -- = Not Applicable; NA = Not Available; W = Withheld to avoid disclosure of individual company data. |
| Release Date: 4/30/2024 |
| Next Release Date: 5/31/2024 |