|
Download Data (XLS File) |
|
||||||||
|
||||||||
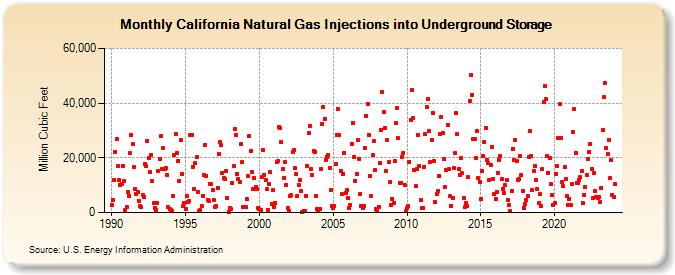
| California Natural Gas Injections into Underground Storage (Million Cubic Feet) | ||||||||
| Year | Jan | Feb | Mar | Apr | May | Jun | Jul | Aug | Sep | Oct | Nov | Dec |
|---|---|---|---|---|---|---|---|---|---|---|---|---|
| 1990 | 2,676 | 4,631 | 11,774 | 22,230 | 26,798 | 17,079 | 11,773 | 10,071 | 10,383 | 17,080 | 11,528 | 1,051 |
| 1991 | 1,964 | 7,531 | 6,205 | 21,709 | 28,179 | 25,042 | 16,510 | 8,436 | 6,788 | 7,412 | 4,368 | 2,289 |
| 1992 | 1,926 | 6,570 | 5,706 | 17,569 | 17,167 | 26,308 | 19,985 | 14,876 | 21,087 | 11,679 | 3,331 | 1,835 |
| 1993 | 915 | 3,429 | 15,021 | 19,520 | 27,830 | 15,806 | 23,522 | 15,977 | 16,113 | 13,773 | 1,939 | 1,289 |
| 1994 | 870 | 494 | 6,150 | 20,903 | 28,804 | 21,822 | 18,914 | 11,381 | 26,575 | 14,221 | 2,254 | 3,522 |
| 1995 | 1,383 | 6,220 | 3,765 | 4,241 | 28,514 | 28,368 | 16,799 | 8,528 | 18,088 | 20,141 | 7,606 | 658 |
| 1996 | 770 | 2,578 | 6,126 | 13,609 | 24,842 | 13,403 | 4,768 | 4,212 | 10,482 | 10,614 | 8,146 | 4,689 |
| 1997 | 2,155 | 2,325 | 9,023 | 21,477 | 25,638 | 24,685 | 14,491 | 12,592 | 12,388 | 15,169 | 5,264 | 306 |
| 1998 | 1,627 | 1,275 | 10,626 | 17,122 | 30,534 | 28,406 | 14,196 | 12,132 | 11,044 | 24,912 | 18,500 | 1,969 |
| 1999 | 2,019 | 1,855 | 4,834 | 13,428 | 28,079 | 22,329 | 14,906 | 8,535 | 12,707 | 9,513 | 8,597 | 1,619 |
| 2000 | 1,316 | 985 | 12,855 | 22,794 | 13,772 | 11,937 | 8,467 | 1,073 | 10,566 | 14,784 | 3,253 | 8,371 |
| 2001 | 2,119 | 3,649 | 18,314 | 18,819 | 31,357 | 30,741 | 25,624 | 16,100 | 12,808 | 18,402 | 10,147 | 1,561 |
| 2002 | 746 | 5,979 | 6,415 | 22,174 | 22,819 | 16,156 | 14,087 | 6,165 | 9,960 | 11,806 | 8,025 | 310 |
| 2003 | 730 | 528 | 5,991 | 17,150 | 29,017 | 31,818 | 15,985 | 13,748 | 22,630 | 22,145 | 5,877 | 1,259 |
| 2004 | 788 | 1,312 | 16,001 | 32,474 | 38,533 | 34,264 | 19,303 | 20,427 | 21,067 | 16,236 | 8,102 | 2,502 |
| 2005 | 1,728 | 2,428 | 17,644 | 28,503 | 37,924 | 28,425 | 15,305 | 6,787 | 14,192 | 21,762 | 7,215 | 8,144 |
| 2006 | 5,385 | 1,727 | 2,671 | 24,979 | 32,829 | 20,337 | 11,641 | 13,965 | 26,537 | 19,597 | 6,950 | 2,337 |
| 2007 | 1,834 | 2,297 | 23,642 | 35,241 | 39,855 | 28,478 | 13,368 | 5,907 | 20,942 | 26,224 | 15,466 | 1,215 |
| 2008 | 656 | 2,214 | 18,281 | 30,348 | 44,128 | 36,771 | 30,944 | 15,364 | 26,399 | 18,486 | 11,128 | 2,643 |
| 2009 | 4,976 | 3,366 | 18,787 | 32,607 | 38,125 | 27,141 | 10,655 | 10,883 | 20,483 | 21,781 | 10,212 | 747 |
| 2010 | 1,827 | 2,387 | 18,604 | 33,906 | 44,959 | 34,433 | 15,418 | 9,566 | 15,833 | 28,486 | 16,980 | 4,411 |
| 2011 | 1,568 | 1,804 | 16,692 | 28,585 | 38,553 | 41,681 | 29,916 | 18,536 | 26,535 | 36,507 | 18,673 | 4,019 |
| 2012 | 6,612 | 7,783 | 13,281 | 28,790 | 34,814 | 28,976 | 19,592 | 9,355 | 15,416 | 32,145 | 15,850 | 6,049 |
| 2013 | 2,400 | 5,145 | 16,367 | 21,631 | 36,229 | 28,781 | 15,933 | 13,891 | 20,028 | 14,296 | 5,344 | 2,003 |
| 2014 | 3,593 | 2,494 | 13,045 | 40,716 | 50,413 | 43,050 | 26,832 | 26,891 | 19,932 | 29,743 | 12,595 | 11,212 |
| 2015 | 5,018 | 15,017 | 20,744 | 25,888 | 30,931 | 19,218 | 17,988 | 11,934 | 17,273 | 23,871 | 12,263 | 6,630 |
| 2016 | 5,046 | 7,694 | 14,460 | 19,176 | 20,553 | 12,383 | 8,781 | 7,190 | 9,915 | 11,842 | 4,770 | 2,663 |
| 2017 | 566 | 7,984 | 23,325 | 19,076 | 26,615 | 18,868 | 12,017 | 12,285 | 20,640 | 13,563 | 7,916 | 1,806 |
| 2018 | 3,074 | 4,672 | 6,111 | 20,282 | 29,837 | 20,848 | 8,126 | 15,354 | 16,978 | 11,965 | 8,469 | 3,400 |
| 2019 | 6,642 | 2,225 | 15,883 | 40,435 | 46,193 | 41,349 | 20,508 | 14,614 | 20,003 | 10,360 | 6,372 | 2,865 |
| 2020 | 3,632 | 14,262 | 16,892 | 27,152 | 39,597 | 27,380 | 11,243 | 9,655 | 16,706 | 12,335 | 6,061 | 2,817 |
| 2021 | 5,106 | 2,784 | 10,313 | 29,358 | 37,701 | 21,859 | 10,942 | 10,861 | 11,877 | 13,064 | 15,215 | 3,325 |
| 2022 | 6,595 | 9,228 | 13,594 | 19,504 | 22,152 | 24,993 | 16,041 | 5,224 | 14,594 | 7,712 | 5,687 | 5,472 |
| 2023 | 5,712 | 3,970 | 8,853 | 30,163 | 42,253 | 47,495 | 23,563 | 21,392 | 26,580 | 12,528 | 19,194 | 6,382 |
| 2024 | 5,763 | |||||||||||
| - = No Data Reported; -- = Not Applicable; NA = Not Available; W = Withheld to avoid disclosure of individual company data. |
| Release Date: 3/29/2024 |
| Next Release Date: 4/30/2024 |