|
Download Data (XLS File) |
|
||||||||
|
||||||||
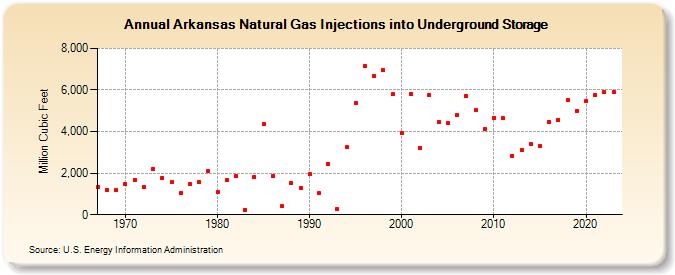
| Arkansas Natural Gas Injections into Underground Storage (Million Cubic Feet) | ||||||||
| Decade | Year-0 | Year-1 | Year-2 | Year-3 | Year-4 | Year-5 | Year-6 | Year-7 | Year-8 | Year-9 |
|---|---|---|---|---|---|---|---|---|---|---|
| 1960's | 1,317 | 1,210 | 1,168 | |||||||
| 1970's | 1,467 | 1,674 | 1,316 | 2,218 | 1,783 | 1,555 | 1,033 | 1,462 | 1,572 | 2,081 |
| 1980's | 1,107 | 1,690 | 1,854 | 241 | 1,817 | 4,359 | 1,871 | 398 | 1,522 | 1,299 |
| 1990's | 1,938 | 1,044 | 2,461 | 272 | 3,249 | 5,368 | 7,152 | 6,665 | 6,951 | 5,784 |
| 2000's | 3,943 | 5,806 | 3,210 | 5,757 | 4,457 | 4,394 | 4,789 | 5,695 | 5,023 | 4,108 |
| 2010's | 4,672 | 4,628 | 2,848 | 3,112 | 3,398 | 3,318 | 4,477 | 4,560 | 5,505 | 5,012 |
| 2020's | 5,453 | 5,757 | 5,883 | 5,884 |
| - = No Data Reported; -- = Not Applicable; NA = Not Available; W = Withheld to avoid disclosure of individual company data. |
| Release Date: 3/29/2024 |
| Next Release Date: 4/30/2024 |