|
Download Data (XLS File) |
|
||||||||
|
||||||||
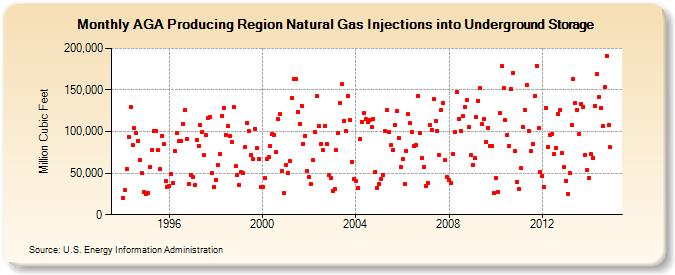
| AGA Producing Region Natural Gas Injections into Underground Storage (Million Cubic Feet) | ||||||||
| Year | Jan | Feb | Mar | Apr | May | Jun | Jul | Aug | Sep | Oct | Nov | Dec |
|---|---|---|---|---|---|---|---|---|---|---|---|---|
| 1994 | 20,366 | 29,330 | 55,297 | 93,538 | 129,284 | 83,943 | 104,001 | 98,054 | 88,961 | 65,486 | 49,635 | 27,285 |
| 1995 | 24,645 | 25,960 | 57,833 | 78,043 | 101,019 | 100,926 | 77,411 | 54,611 | 94,759 | 84,671 | 40,182 | 33,836 |
| 1996 | 34,389 | 48,922 | 38,040 | 76,100 | 98,243 | 88,202 | 88,653 | 109,284 | 125,616 | 91,618 | 37,375 | 48,353 |
| 1997 | 45,327 | 35,394 | 89,625 | 83,137 | 107,821 | 99,742 | 71,360 | 95,278 | 116,634 | 117,497 | 49,750 | 33,170 |
| 1998 | 41,880 | 59,324 | 73,582 | 119,021 | 128,323 | 96,261 | 107,136 | 94,705 | 87,920 | 129,117 | 58,026 | 47,924 |
| 1999 | 35,830 | 50,772 | 49,673 | 80,879 | 110,064 | 100,132 | 72,348 | 67,286 | 103,587 | 79,714 | 66,465 | 32,984 |
| 2000 | 33,638 | 43,661 | 67,262 | 69,370 | 82,701 | 97,638 | 95,760 | 75,277 | 114,547 | 120,948 | 52,607 | 25,836 |
| 2001 | 59,765 | 50,099 | 64,085 | 140,486 | 163,641 | 162,842 | 123,981 | 109,135 | 131,043 | 85,506 | 95,168 | 52,143 |
| 2002 | 44,875 | 36,591 | 65,281 | 100,010 | 142,349 | 106,578 | 84,779 | 77,723 | 106,967 | 85,178 | 47,413 | 44,421 |
| 2003 | 28,994 | 30,559 | 77,796 | 98,512 | 133,870 | 156,950 | 113,093 | 100,107 | 142,929 | 114,012 | 63,879 | 43,133 |
| 2004 | 40,218 | 31,932 | 90,980 | 111,947 | 122,289 | 114,761 | 111,687 | 114,301 | 105,126 | 115,106 | 51,655 | 32,696 |
| 2005 | 36,392 | 42,896 | 47,848 | 100,260 | 126,052 | 99,174 | 83,242 | 77,559 | 107,451 | 124,405 | 92,412 | 57,153 |
| 2006 | 66,752 | 36,632 | 77,117 | 120,704 | 110,084 | 99,838 | 83,217 | 83,386 | 142,551 | 98,048 | 67,884 | 57,546 |
| 2007 | 34,921 | 37,567 | 107,711 | 102,296 | 138,903 | 112,200 | 100,344 | 71,353 | 126,201 | 133,893 | 65,512 | 45,178 |
| 2008 | 41,855 | 38,419 | 73,261 | 99,772 | 147,965 | 115,205 | 100,875 | 118,151 | 129,607 | 137,952 | 104,919 | 71,944 |
| 2009 | 59,735 | 67,683 | 117,455 | 137,311 | 151,807 | 108,974 | 114,719 | 87,991 | 104,759 | 82,922 | 83,021 | 26,309 |
| 2010 | 44,256 | 27,510 | 122,596 | 178,417 | 151,810 | 113,383 | 96,203 | 82,613 | 151,157 | 170,964 | 76,889 | 39,144 |
| 2011 | 30,683 | 55,593 | 105,497 | 125,870 | 155,462 | 100,661 | 76,102 | 84,748 | 142,289 | 179,242 | 103,869 | 51,365 |
| 2012 | 46,941 | 32,930 | 128,836 | 82,012 | 96,128 | 97,410 | 73,345 | 79,659 | 120,896 | 125,854 | 74,378 | 56,908 |
| 2013 | 41,085 | 25,148 | 49,591 | 107,825 | 163,573 | 134,559 | 125,920 | 97,629 | 133,536 | 129,893 | 72,256 | 53,395 |
| 2014 | 43,892 | 72,414 | 68,720 | 131,122 | 168,742 | 141,860 | 128,251 | 106,384 | 153,563 | 191,243 | 107,282 | 80,991 |
| - = No Data Reported; -- = Not Applicable; NA = Not Available; W = Withheld to avoid disclosure of individual company data. |
| Release Date: 4/30/2024 |
| Next Release Date: 5/31/2024 |