|
Download Data (XLS File) |
|
||||||||
|
||||||||
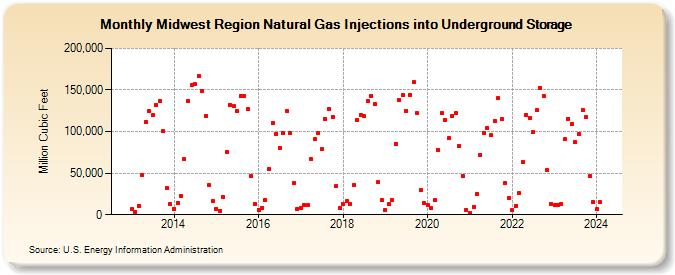
| Midwest Region Natural Gas Injections into Underground Storage (Million Cubic Feet) | ||||||||
| Year | Jan | Feb | Mar | Apr | May | Jun | Jul | Aug | Sep | Oct | Nov | Dec |
|---|---|---|---|---|---|---|---|---|---|---|---|---|
| 2013 | 6,816 | 3,305 | 10,916 | 48,080 | 111,863 | 124,364 | 119,860 | 131,882 | 137,025 | 100,889 | 31,909 | 12,286 |
| 2014 | 7,437 | 14,235 | 22,615 | 66,408 | 136,813 | 155,687 | 156,839 | 166,332 | 149,212 | 119,162 | 35,641 | 16,420 |
| 2015 | 7,175 | 4,818 | 21,020 | 74,870 | 132,494 | 130,148 | 124,884 | 142,755 | 143,303 | 127,582 | 46,136 | 13,096 |
| 2016 | 6,165 | 8,494 | 17,356 | 55,078 | 110,430 | 97,400 | 80,535 | 98,096 | 124,825 | 98,168 | 37,946 | 6,964 |
| 2017 | 8,303 | 11,625 | 11,088 | 66,657 | 90,635 | 98,549 | 78,509 | 115,345 | 126,688 | 117,500 | 34,353 | 8,322 |
| 2018 | 12,451 | 16,114 | 13,051 | 35,907 | 114,124 | 120,213 | 118,654 | 137,095 | 142,888 | 132,732 | 38,861 | 17,807 |
| 2019 | 5,163 | 12,738 | 17,252 | 85,460 | 137,524 | 143,613 | 125,193 | 144,444 | 159,165 | 121,865 | 29,285 | 13,739 |
| 2020 | 11,725 | 7,650 | 17,340 | 78,257 | 122,357 | 113,752 | 91,851 | 118,511 | 121,731 | 82,720 | 46,965 | 5,442 |
| 2021 | 1,889 | 9,534 | 25,467 | 72,341 | 98,819 | 103,722 | 95,741 | 113,178 | 139,890 | 115,317 | 37,813 | 19,715 |
| 2022 | 5,076 | 10,608 | 25,948 | 62,889 | 120,344 | 116,887 | 99,294 | 125,383 | 152,500 | 142,558 | 53,536 | 13,242 |
| 2023 | 11,319 | 11,357 | 12,599 | 90,458 | 115,462 | 109,151 | 87,422 | 96,716 | 126,070 | 117,048 | 46,194 | 15,477 |
| 2024 | 6,559 | |||||||||||
| - = No Data Reported; -- = Not Applicable; NA = Not Available; W = Withheld to avoid disclosure of individual company data. |
| Release Date: 3/29/2024 |
| Next Release Date: 4/30/2024 |