|
Download Data (XLS File) |
|
||||||||
|
||||||||
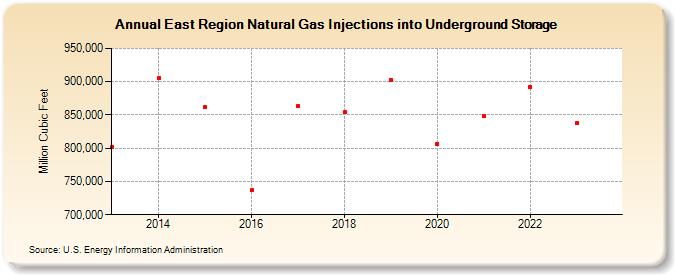
| East Region Natural Gas Injections into Underground Storage (Million Cubic Feet) | ||||||||
| Decade | Year-0 | Year-1 | Year-2 | Year-3 | Year-4 | Year-5 | Year-6 | Year-7 | Year-8 | Year-9 |
|---|---|---|---|---|---|---|---|---|---|---|
| 2010's | 801,041 | 905,669 | 861,938 | 737,224 | 863,392 | 854,119 | 903,051 | |||
| 2020's | 806,832 | 847,944 | 891,826 | 837,292 |
| - = No Data Reported; -- = Not Applicable; NA = Not Available; W = Withheld to avoid disclosure of individual company data. |
| Release Date: 3/29/2024 |
| Next Release Date: 4/30/2024 |