|
Download Data (XLS File) |
|
|||||
|
|||||
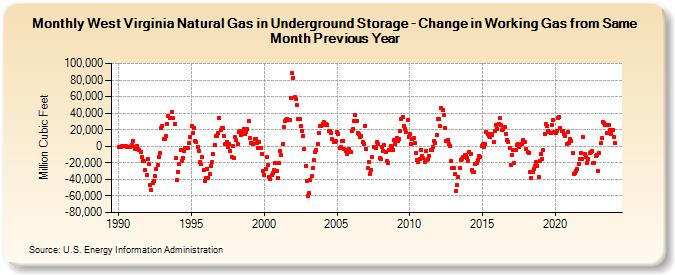
| West Virginia Natural Gas in Underground Storage - Change in Working Gas from Same Month Previous Year (Million Cubic Feet) | |||||
| Year | Jan | Feb | Mar | Apr | May | Jun | Jul | Aug | Sep | Oct | Nov | Dec |
|---|---|---|---|---|---|---|---|---|---|---|---|---|
| 1990 | -1,093 | -693 | -375 | 128 | 493 | 786 | 2 | -447 | -512 | -333 | -99 | 1,138 |
| 1991 | 6,825 | -2,677 | -1,109 | 134 | -3,564 | -4,731 | -6,487 | -12,806 | -17,650 | -17,773 | -28,530 | -34,101 |
| 1992 | -15,454 | -21,567 | -46,663 | -52,768 | -43,995 | -42,430 | -35,909 | -27,164 | -22,183 | -12,950 | -7,815 | 22,584 |
| 1993 | 24,960 | 9,394 | 9,292 | 12,636 | 27,031 | 36,232 | 34,023 | 34,755 | 41,628 | 34,399 | 26,968 | -14,222 |
| 1994 | -40,501 | -30,621 | -21,008 | -4,595 | -17,438 | -13,653 | -5,670 | -2,609 | -2,058 | -1,674 | 4,099 | 10,639 |
| 1995 | 25,027 | 16,310 | 22,537 | 6,655 | 5,546 | -896 | -5,421 | -18,718 | -21,810 | -13,288 | -28,780 | -41,453 |
| 1996 | -37,712 | -27,148 | -37,955 | -33,384 | -23,960 | -19,104 | -8,996 | 1,930 | 12,322 | 13,039 | 16,232 | 33,582 |
| 1997 | 19,775 | 21,766 | 22,243 | 12,263 | 2,835 | 5,547 | -1,433 | 2,813 | -5,937 | -13,049 | -115 | -14,214 |
| 1998 | 10,847 | 7,225 | 2,808 | 17,268 | 18,947 | 13,573 | 15,975 | 20,934 | 15,102 | 16,927 | 20,489 | 30,285 |
| 1999 | 9,770 | 3,968 | 3,590 | 3,247 | 9,140 | 9,038 | 4,337 | -1,695 | 5,079 | -1,632 | -9,023 | -29,319 |
| 2000 | -34,927 | -27,081 | -13,419 | -22,522 | -36,721 | -40,018 | -34,732 | -32,429 | -28,612 | -20,086 | -30,158 | -38,485 |
| 2001 | -20,352 | -6,160 | -10,149 | 2,443 | 23,800 | 30,093 | 32,357 | 32,952 | 31,587 | 31,856 | 58,084 | 88,023 |
| 2002 | 83,023 | 59,516 | 56,628 | 50,081 | 33,101 | 33,504 | 24,413 | 18,937 | 12,818 | -3,215 | -24,068 | -41,714 |
| 2003 | -60,367 | -56,839 | -41,040 | -36,199 | -26,164 | -17,040 | -7,234 | -4,972 | 2,440 | 16,257 | 24,230 | 24,415 |
| 2004 | 26,444 | 28,970 | 25,239 | 26,752 | 25,860 | 18,483 | 18,387 | 16,080 | 8,427 | 4,663 | 4,675 | 5,807 |
| 2005 | 16,851 | 14,852 | -2,059 | -1,070 | 6,380 | 6,593 | -2,844 | -5,302 | -8,833 | -4,921 | -3,134 | -6,423 |
| 2006 | 18,880 | 21,178 | 30,542 | 37,217 | 29,968 | 15,860 | 14,763 | 11,031 | 12,447 | 5,179 | 3,209 | 24,382 |
| 2007 | -3,137 | -26,567 | -18,856 | -33,108 | -28,088 | -12,659 | -1,295 | -1,023 | -2,065 | 5,395 | 2,662 | -14,693 |
| 2008 | -15,370 | -928 | -6,237 | 1,250 | -6,312 | -18,127 | -20,160 | -4,240 | 24 | -1,486 | -3,921 | 7,668 |
| 2009 | 2,548 | 10,343 | 6,738 | 8,243 | 18,659 | 33,290 | 35,396 | 24,610 | 20,900 | 16,789 | 31,299 | 11,745 |
| 2010 | 14,707 | 2,707 | 9,077 | 9,625 | 4,068 | -8,106 | -16,873 | -18,673 | -15,215 | -4,063 | -12,299 | -14,646 |
| 2011 | -19,309 | -5,837 | -16,701 | -14,859 | -11,249 | -4,818 | -4,311 | -569 | 6,257 | 3,697 | 13,069 | 32,440 |
| 2012 | 32,477 | 24,155 | 45,965 | 43,929 | 37,807 | 22,259 | 6,785 | 7,894 | 2,675 | 321 | -17,752 | -26,597 |
| 2013 | -25,855 | -33,747 | -54,077 | -46,512 | -37,152 | -26,415 | -16,438 | -14,783 | -12,777 | -10,773 | -10,608 | -14,270 |
| 2014 | -17,336 | -6,498 | -8,924 | -28,118 | -31,545 | -31,116 | -21,484 | -19,859 | -16,323 | -11,917 | -13,142 | 886 |
| 2015 | 2,272 | -489 | 2,861 | 17,610 | 15,123 | 12,945 | 10,758 | 15,119 | 13,804 | 5,528 | 19,054 | 25,230 |
| 2016 | 21,210 | 26,758 | 34,404 | 25,659 | 19,439 | 20,497 | 23,085 | 15,133 | 7,731 | 5,596 | -2,282 | -22,477 |
| 2017 | -10,026 | -4,272 | -20,212 | -4,592 | 1,976 | 2,577 | -1,310 | 1,501 | 3,107 | 7,647 | 4,637 | 5,472 |
| 2018 | -3,227 | -7,034 | -7,608 | -31,571 | -37,688 | -30,930 | -27,297 | -24,366 | -19,062 | -23,236 | -36,919 | -17,198 |
| 2019 | -8,970 | -15,111 | -4,659 | 15,452 | 26,377 | 24,755 | 18,693 | 17,249 | 15,610 | 26,237 | 31,888 | 17,828 |
| 2020 | 15,874 | 18,895 | 34,664 | 35,130 | 22,471 | 18,505 | 18,896 | 14,791 | 12,585 | 3,223 | 16,952 | 3,939 |
| 2021 | 8,485 | 6,413 | -8,611 | -33,046 | -31,950 | -29,344 | -27,677 | -21,722 | -15,027 | -8,368 | -15,438 | 11,061 |
| 2022 | -8,774 | -12,518 | -20,723 | -15,495 | -7,999 | -7,108 | -5,886 | -19,891 | -20,380 | -12,254 | -10,467 | -29,811 |
| 2023 | -8,486 | 4,157 | 9,653 | 29,355 | 27,737 | 25,146 | 16,247 | 25,260 | 25,382 | 19,162 | 14,996 | 19,817 |
| 2024 | 11,446 | 3,680 | 7,669 | 6,862 | 14,375 | 12,389 | ||||||
| - = No Data Reported; -- = Not Applicable; NA = Not Available; W = Withheld to avoid disclosure of individual company data. |
| Release Date: 8/30/2024 |
| Next Release Date: 9/30/2024 |