|
Download Data (XLS File) |
|
|||||
|
|||||
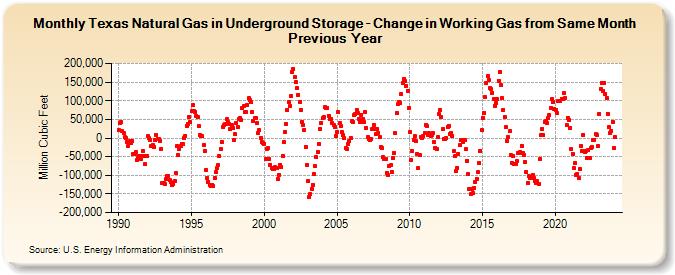
| Texas Natural Gas in Underground Storage - Change in Working Gas from Same Month Previous Year (Million Cubic Feet) | |||||
| Year | Jan | Feb | Mar | Apr | May | Jun | Jul | Aug | Sep | Oct | Nov | Dec |
|---|---|---|---|---|---|---|---|---|---|---|---|---|
| 1990 | 21,315 | 40,513 | 43,111 | 18,628 | 12,189 | 2,033 | 47 | -10,549 | -21,072 | -9,288 | -13,355 | -8,946 |
| 1991 | -42,316 | -43,449 | -37,554 | -58,118 | -54,100 | -46,988 | -56,199 | -48,651 | -34,294 | -48,087 | -70,444 | -48,747 |
| 1992 | 5,209 | -1,207 | -6,517 | -21,448 | -17,577 | -24,644 | -6,465 | 9,218 | -3,044 | -2,525 | -6,948 | -28,550 |
| 1993 | -119,345 | -120,895 | -123,412 | -110,528 | -102,328 | -100,860 | -113,541 | -118,288 | -125,086 | -122,661 | -114,692 | -94,084 |
| 1994 | -21,524 | -45,478 | -29,527 | -21,615 | -15,311 | -16,358 | -113 | 6,609 | 32,786 | 38,411 | 56,777 | 41,703 |
| 1995 | 71,748 | 88,600 | 72,969 | 70,544 | 59,709 | 56,910 | 31,618 | 8,138 | 5,482 | 4,572 | -18,623 | -35,336 |
| 1996 | -85,283 | -107,001 | -116,912 | -125,640 | -128,814 | -125,038 | -128,900 | -106,690 | -92,118 | -81,360 | -72,678 | -48,247 |
| 1997 | -29,812 | -9,460 | 29,850 | 34,280 | 36,401 | 50,052 | 43,301 | 37,842 | 23,806 | 36,119 | 26,432 | -4,528 |
| 1998 | 10,417 | 41,517 | 29,018 | 52,321 | 54,978 | 49,491 | 79,854 | 85,099 | 69,685 | 68,758 | 89,104 | 107,366 |
| 1999 | 101,009 | 95,505 | 70,956 | 46,039 | 53,619 | 53,042 | 40,727 | 13,685 | 20,415 | 560 | -10,142 | -12,563 |
| 2000 | -15,953 | -56,603 | -28,372 | -26,451 | -56,382 | -71,241 | -80,077 | -82,538 | -82,245 | -78,962 | -81,008 | -109,542 |
| 2001 | -97,935 | -71,290 | -77,838 | -47,419 | -10,719 | 17,306 | 38,455 | 75,191 | 95,745 | 86,524 | 111,673 | 177,917 |
| 2002 | 184,156 | 163,557 | 150,295 | 133,089 | 116,602 | 97,377 | 76,133 | 43,795 | 34,022 | 22,792 | -23,125 | -71,617 |
| 2003 | -115,386 | -158,376 | -150,022 | -135,682 | -125,213 | -95,853 | -75,768 | -51,007 | -36,458 | -15,896 | 25,425 | 41,296 |
| 2004 | 54,328 | 55,190 | 82,444 | 80,043 | 81,411 | 60,193 | 51,104 | 52,308 | 39,155 | 35,730 | 30,294 | 5,567 |
| 2005 | 16,407 | 68,796 | 39,542 | 32,344 | 15,064 | 7,753 | -885 | -27,790 | -28,227 | -16,424 | -8,695 | 1,015 |
| 2006 | 44,378 | 43,543 | 60,962 | 64,188 | 76,158 | 66,556 | 51,417 | 42,628 | 62,505 | 50,194 | 42,834 | 70,592 |
| 2007 | 26,833 | 2,331 | -3,100 | -5,090 | -2,396 | 23,982 | 34,852 | 24,388 | 9,780 | 25,535 | 13,722 | 2,138 |
| 2008 | -22,964 | -26,953 | -51,663 | -55,552 | -56,239 | -94,439 | -99,814 | -75,694 | -73,293 | -89,951 | -53,580 | -39,499 |
| 2009 | 12,468 | 67,728 | 90,117 | 97,832 | 94,463 | 118,215 | 148,178 | 158,060 | 152,320 | 140,862 | 127,287 | 80,845 |
| 2010 | 16,598 | -59,148 | -34,942 | -6,273 | 4,140 | -8,812 | -42,865 | -81,102 | -46,557 | 2,722 | 593 | 4,690 |
| 2011 | 12,413 | 36,176 | 31,995 | 9,281 | 12,873 | 6,569 | 7,379 | 13,522 | -11,804 | -25,953 | -30,477 | 2,227 |
| 2012 | 63,841 | 74,931 | 56,333 | 23,911 | -1,838 | -2,204 | 89 | 30,484 | 33,065 | 11,034 | 12,963 | 5,108 |
| 2013 | -35,596 | -47,618 | -88,548 | -79,694 | -42,059 | -19,986 | -4,234 | -4,053 | -10,137 | -5,329 | -30,672 | -60,931 |
| 2014 | -95,717 | -136,980 | -151,436 | -136,532 | -147,179 | -133,895 | -118,685 | -109,584 | -92,023 | -66,054 | -33,650 | 22,067 |
| 2015 | 54,838 | 67,692 | 108,804 | 146,498 | 165,834 | 155,813 | 134,870 | 130,886 | 121,603 | 103,543 | 86,959 | 94,731 |
| 2016 | 103,720 | 154,140 | 177,174 | 142,516 | 107,354 | 76,072 | 56,455 | 28,349 | -6,902 | 1,571 | 17,684 | -45,827 |
| 2017 | -66,408 | -47,620 | -68,417 | -71,015 | -62,886 | -39,782 | -40,152 | -37,737 | -20,154 | -40,744 | -46,213 | -64,288 |
| 2018 | -90,692 | -120,845 | -102,650 | -106,042 | -106,236 | -98,669 | -106,203 | -115,827 | -121,446 | -116,318 | -124,494 | -55,907 |
| 2019 | 7,346 | 25,242 | 7,570 | 44,312 | 45,528 | 39,982 | 54,792 | 61,091 | 79,930 | 104,038 | 97,630 | 77,937 |
| 2020 | 76,426 | 67,770 | 99,185 | 99,140 | 99,070 | 105,861 | 105,377 | 119,519 | 106,742 | 34,005 | 54,465 | 48,509 |
| 2021 | 27,919 | -30,547 | -41,909 | -81,708 | -67,853 | -98,293 | -96,276 | -108,220 | -83,323 | -21,739 | -33,952 | 9,182 |
| 2022 | -37,332 | -33,987 | -52,524 | -32,422 | -53,534 | -26,999 | -24,405 | -4,953 | -4,358 | 9,712 | 8,948 | -21,131 |
| 2023 | 65,668 | 131,662 | 147,574 | 125,228 | 128,480 | 118,619 | 108,348 | 65,476 | 28,949 | 12,819 | 18,979 | 44,118 |
| 2024 | -26,863 | 1,872 | 25,042 | 32,148 | 18,224 | 14,303 | ||||||
| - = No Data Reported; -- = Not Applicable; NA = Not Available; W = Withheld to avoid disclosure of individual company data. |
| Release Date: 8/30/2024 |
| Next Release Date: 9/30/2024 |