|
Download Data (XLS File) |
|
|||||
|
|||||
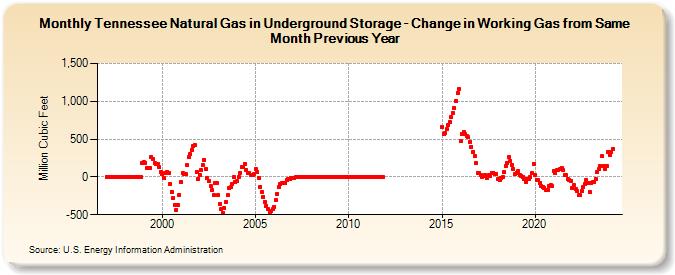
| Tennessee Natural Gas in Underground Storage - Change in Working Gas from Same Month Previous Year (Million Cubic Feet) | |||||
| Year | Jan | Feb | Mar | Apr | May | Jun | Jul | Aug | Sep | Oct | Nov | Dec |
|---|---|---|---|---|---|---|---|---|---|---|---|---|
| 1997 | 0 | 0 | 0 | 0 | 0 | 0 | 0 | 0 | 0 | 0 | 0 | 0 |
| 1998 | 0 | 0 | 0 | 0 | 0 | 0 | 0 | 0 | 0 | 0 | 0 | 184 |
| 1999 | 197 | 189 | 118 | 122 | 119 | 262 | 235 | 178 | 169 | 171 | 125 | 68 |
| 2000 | 34 | -17 | 51 | 68 | 53 | -90 | -197 | -274 | -377 | -433 | -377 | -236 |
| 2001 | -68 | 48 | 38 | 32 | 153 | 266 | 298 | 360 | 407 | 420 | 65 | -22 |
| 2002 | 24 | 85 | 159 | 228 | 100 | -16 | -60 | -126 | -176 | -240 | -86 | -85 |
| 2003 | -243 | -354 | -424 | -471 | -411 | -332 | -244 | -145 | -140 | -92 | -4 | -66 |
| 2004 | -60 | -1 | 55 | 133 | 131 | 177 | 89 | 49 | 52 | 31 | 19 | 40 |
| 2005 | 100 | 71 | -16 | -129 | -202 | -265 | -328 | -383 | -426 | -460 | -454 | -426 |
| 2006 | -392 | -312 | -220 | -139 | -98 | -81 | -81 | -81 | -44 | -34 | -29 | -16 |
| 2007 | -8 | -8 | 0 | 0 | 0 | 0 | 0 | 0 | 0 | 0 | 0 | 0 |
| 2008 | 0 | 0 | 0 | 0 | 0 | 0 | 0 | 0 | 0 | 0 | 0 | 0 |
| 2009 | 0 | 0 | 0 | 0 | 0 | 0 | 0 | 0 | 0 | 0 | 0 | 0 |
| 2010 | 0 | 0 | 0 | 0 | 0 | 0 | 0 | 0 | 0 | 0 | 0 | 0 |
| 2011 | 0 | 0 | 0 | 0 | 0 | 0 | 0 | 0 | 0 | 0 | 0 | |
| 2015 | 666 | 570 | 580 | 627 | 680 | 729 | 789 | 848 | 913 | 1,005 | 1,107 | 1,162 |
| 2016 | 470 | 573 | 595 | 565 | 537 | 524 | 464 | 400 | 333 | 274 | 182 | 55 |
| 2017 | 49 | 29 | 2 | 14 | 21 | -15 | 19 | 13 | 57 | 55 | 40 | 45 |
| 2018 | -28 | -39 | -14 | 0 | 64 | 139 | 188 | 257 | 213 | 158 | 105 | 34 |
| 2019 | 58 | 76 | 22 | 16 | 0 | -30 | -64 | -27 | -25 | -2 | 48 | 174 |
| 2020 | 30 | -36 | -39 | -77 | -114 | -129 | -143 | -169 | -169 | -119 | -112 | -123 |
| 2021 | 80 | 53 | 87 | 90 | 103 | 124 | 89 | 20 | 20 | -30 | -42 | -53 |
| 2022 | -145 | -109 | -160 | -188 | -243 | -243 | -186 | -137 | -91 | -42 | -79 | -197 |
| 2023 | -83 | -68 | -70 | -24 | 62 | 104 | 143 | 270 | 149 | 101 | 148 | 323 |
| 2024 | 289 | 328 | 373 | 399 | 385 | 382 | ||||||
| - = No Data Reported; -- = Not Applicable; NA = Not Available; W = Withheld to avoid disclosure of individual company data. |
| Release Date: 8/30/2024 |
| Next Release Date: 9/30/2024 |