|
Download Data (XLS File) |
|
|||||
|
|||||
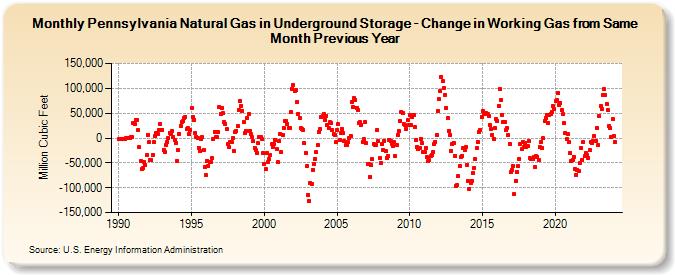
| Pennsylvania Natural Gas in Underground Storage - Change in Working Gas from Same Month Previous Year (Million Cubic Feet) | |||||
| Year | Jan | Feb | Mar | Apr | May | Jun | Jul | Aug | Sep | Oct | Nov | Dec |
|---|---|---|---|---|---|---|---|---|---|---|---|---|
| 1990 | -2,863 | -1,902 | -2,297 | -1,134 | -1,671 | -1,997 | -907 | -144 | 629 | 992 | 2,290 | 1,354 |
| 1991 | 30,778 | 27,964 | 37,141 | 36,920 | 15,424 | -18,322 | -46,969 | -63,245 | -61,004 | -48,820 | -54,587 | -34,458 |
| 1992 | 6,870 | -8,479 | -43,753 | -43,739 | -33,236 | -8,601 | 3,190 | 9,732 | 8,583 | 15,815 | 27,780 | 16,330 |
| 1993 | 16,748 | -23,871 | -27,342 | -13,729 | -7,043 | -138 | 11,093 | 8,174 | 14,808 | 2,868 | -4,885 | -9,642 |
| 1994 | -45,776 | -23,124 | 8,987 | 25,048 | 32,148 | 34,360 | 39,360 | 43,202 | 18,502 | 20,447 | 7,409 | 15,602 |
| 1995 | 60,371 | 42,037 | 36,507 | 9,811 | 2,098 | -569 | -19,226 | -25,702 | -1,403 | 1,156 | -23,733 | -57,737 |
| 1996 | -75,032 | -45,509 | -55,896 | -48,636 | -47,663 | -40,651 | -1,276 | 12,641 | 2,462 | 1,414 | 12,059 | 63,322 |
| 1997 | 49,038 | 59,960 | 50,263 | 31,778 | 29,181 | 17,628 | -11,401 | -18,671 | -7,659 | -8,535 | -833 | -26,112 |
| 1998 | 11,818 | 15,107 | 23,807 | 56,487 | 73,715 | 64,954 | 55,349 | 31,462 | 10,457 | 14,444 | 40,506 | 48,153 |
| 1999 | 14,687 | 7,115 | 1,197 | -6,824 | -19,921 | -24,828 | -29,217 | -10,928 | 2,745 | 1,798 | -2,933 | -30,017 |
| 2000 | -52,794 | -63,191 | -29,759 | -49,249 | -42,345 | -34,675 | -12,727 | -18,369 | -12,140 | -4,443 | -21,847 | -49,085 |
| 2001 | -6,778 | 8,944 | -29,044 | 6,779 | 19,744 | 34,106 | 34,530 | 28,570 | 20,410 | 20,544 | 51,584 | 99,118 |
| 2002 | 106,666 | 95,472 | 96,753 | 72,810 | 49,081 | 40,610 | 19,942 | 18,826 | 16,730 | -10,599 | -30,043 | -56,881 |
| 2003 | -115,040 | -127,648 | -90,356 | -91,640 | -63,886 | -51,944 | -42,218 | -28,642 | -14,554 | 12,923 | 19,073 | 42,561 |
| 2004 | 44,040 | 48,270 | 37,065 | 45,184 | 26,012 | 19,399 | 31,236 | 30,941 | 16,616 | 7,756 | 6,561 | -8,853 |
| 2005 | 16,482 | 27,340 | -3,654 | 10,047 | 18,395 | 9,162 | -5,538 | -14,568 | -14,910 | -8,218 | 798 | 4,286 |
| 2006 | 72,596 | 61,507 | 79,604 | 77,150 | 61,180 | 55,950 | 30,505 | 31,590 | 26,371 | -7,718 | -2,811 | 32,908 |
| 2007 | -10,671 | -52,680 | -51,323 | -77,847 | -53,358 | -42,729 | -11,950 | -13,997 | -13,801 | 15,943 | -5,800 | -41,076 |
| 2008 | -49,905 | -12,616 | -23,860 | -5,437 | -26,723 | -39,380 | -37,184 | -3,459 | -6,834 | -12,170 | -16,099 | -8,056 |
| 2009 | -36,953 | -13,432 | 6,629 | 13,390 | 33,335 | 52,467 | 50,671 | 27,717 | 25,974 | 18,359 | 36,881 | 25,574 |
| 2010 | 45,399 | 26,786 | 42,820 | 45,998 | 21,285 | -3,721 | -18,013 | -22,912 | -20,640 | -1,860 | -10,433 | -27,242 |
| 2011 | -27,193 | -19,334 | -38,608 | -46,342 | -45,052 | -36,861 | -33,916 | -28,503 | -12,240 | -7,869 | 5,882 | 54,849 |
| 2012 | 77,912 | 95,029 | 123,711 | 113,985 | 100,224 | 87,275 | 60,472 | 40,179 | 14,261 | 6,227 | -25,789 | -11,919 |
| 2013 | -9,810 | -36,060 | -95,583 | -94,591 | -76,953 | -56,652 | -38,627 | -35,227 | -20,903 | -24,376 | -18,569 | -53,420 |
| 2014 | -86,299 | -102,067 | -91,397 | -85,937 | -70,069 | -59,819 | -43,007 | -20,332 | -7,469 | 12,995 | 16,185 | 42,184 |
| 2015 | 54,660 | 50,294 | 48,892 | 50,218 | 49,319 | 44,610 | 27,203 | 18,232 | 6,781 | -1,466 | 20,561 | 38,300 |
| 2016 | 34,424 | 64,473 | 98,696 | 77,397 | 46,930 | 31,712 | 31,784 | 15,322 | 19,876 | 5,333 | -11,146 | -69,154 |
| 2017 | -64,135 | -55,967 | -113,544 | -85,898 | -67,690 | -56,984 | -41,504 | -12,645 | -22,706 | -8,168 | -18,172 | -9,820 |
| 2018 | -17,305 | -16,705 | -6,351 | -40,632 | -41,366 | -41,963 | -38,897 | -57,860 | -37,091 | -37,891 | -43,449 | -18,247 |
| 2019 | -8,218 | -19,701 | -506 | 33,877 | 39,960 | 47,145 | 30,759 | 46,471 | 48,167 | 51,990 | 64,207 | 57,868 |
| 2020 | 74,118 | 75,510 | 90,794 | 66,124 | 70,676 | 55,734 | 47,756 | 30,210 | 10,342 | -2,918 | 7,848 | -8,084 |
| 2021 | -29,384 | -45,620 | -43,392 | -37,949 | -61,746 | -74,160 | -63,658 | -66,584 | -50,443 | -19,986 | -43,267 | -7,519 |
| 2022 | -36,866 | -30,187 | -33,920 | -39,635 | -24,557 | -7,822 | -10,990 | -5,779 | 3,942 | -6,822 | 20,504 | -14,300 |
| 2023 | 44,547 | 64,002 | 58,205 | 87,232 | 97,653 | 86,656 | 68,601 | 56,269 | 23,574 | 19,700 | 2,022 | 38,497 |
| 2024 | 3,704 | -7,944 | 10,751 | 6,658 | -1,264 | -706 | ||||||
| - = No Data Reported; -- = Not Applicable; NA = Not Available; W = Withheld to avoid disclosure of individual company data. |
| Release Date: 8/30/2024 |
| Next Release Date: 9/30/2024 |