|
Download Data (XLS File) |
|
|||||
|
|||||
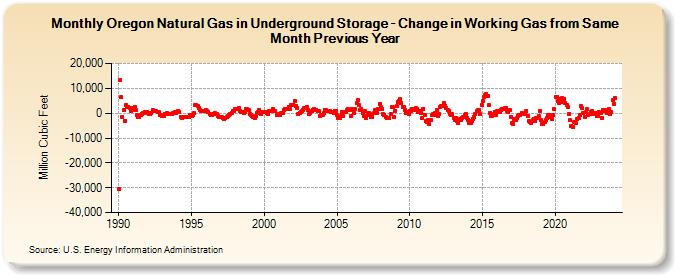
| Oregon Natural Gas in Underground Storage - Change in Working Gas from Same Month Previous Year (Million Cubic Feet) | |||||
| Year | Jan | Feb | Mar | Apr | May | Jun | Jul | Aug | Sep | Oct | Nov | Dec |
|---|---|---|---|---|---|---|---|---|---|---|---|---|
| 1990 | -30,641 | 13,186 | 6,384 | -1,434 | 1,227 | -3,129 | 3,399 | 2,573 | 2,606 | 1,953 | 968 | 1,423 |
| 1991 | 1,986 | 2,360 | 1,291 | -869 | -1,664 | -1,353 | -659 | -203 | 99 | 250 | 317 | 582 |
| 1992 | 89 | -487 | -305 | 231 | 1,089 | 1,075 | 811 | 730 | 509 | 343 | -779 | -872 |
| 1993 | -1,222 | -1,079 | -221 | -204 | -131 | -374 | -387 | -356 | -231 | 86 | 454 | -69 |
| 1994 | 587 | 858 | 640 | -1,359 | -1,793 | -1,593 | -1,578 | -1,544 | -1,438 | -1,674 | -1,380 | -915 |
| 1995 | -1,331 | -589 | -83 | 3,208 | 3,177 | 2,713 | 2,212 | 1,136 | 939 | 685 | 1,065 | 880 |
| 1996 | 1,306 | 751 | 539 | -460 | -916 | -777 | -340 | 97 | -286 | -492 | -987 | -1,405 |
| 1997 | -1,494 | -1,632 | -1,900 | -2,312 | -1,796 | -1,366 | -1,258 | -573 | -286 | 14 | 816 | 1,019 |
| 1998 | 1,820 | 1,645 | 1,630 | 2,093 | 854 | 662 | 274 | -29 | 398 | 1,839 | 1,540 | 1,171 |
| 1999 | -268 | -732 | -983 | -1,636 | -1,804 | -1,202 | 60 | 554 | 1,278 | -256 | 385 | 516 |
| 2000 | 300 | 451 | -130 | -178 | 859 | 889 | 984 | 1,688 | 846 | 846 | -544 | -746 |
| 2001 | -192 | -890 | -86 | -113 | 1,169 | 1,686 | 1,773 | 1,616 | 2,468 | 1,761 | 3,325 | 3,229 |
| 2002 | 3,447 | 4,923 | 3,026 | 2,188 | -454 | 167 | 551 | 811 | 1,460 | 1,970 | 2,121 | 2,495 |
| 2003 | 1,351 | -229 | 204 | 678 | 1,282 | 1,629 | 1,298 | 1,318 | 1,037 | 793 | -1,104 | -800 |
| 2004 | -911 | -45 | 1,439 | 1,137 | 1,016 | 873 | 748 | 630 | 455 | 196 | 1,015 | 707 |
| 2005 | -540 | -1,876 | -2,009 | -1,248 | 341 | -1,289 | 371 | 652 | 1,108 | 1,840 | 1,277 | -1,222 |
| 2006 | 1,730 | 1,334 | 270 | 1,696 | 3,922 | 5,369 | 3,225 | 1,235 | 1,553 | 115 | -950 | 776 |
| 2007 | -1,865 | -752 | 150 | -402 | -1,725 | -1,507 | -104 | 1,144 | 1 | 40 | 1,665 | 3,843 |
| 2008 | 2,300 | 1,731 | -376 | -906 | -1,588 | -1,907 | -1,949 | -1,984 | -408 | 2,328 | 2,358 | -1,659 |
| 2009 | 1,052 | 2,919 | 4,693 | 5,065 | 5,579 | 4,202 | 2,680 | 2,652 | 1,258 | -122 | 509 | -429 |
| 2010 | 1,000 | 806 | 1,596 | 1,200 | 1,853 | 1,972 | 1,601 | 476 | 786 | 194 | -1,991 | 1,786 |
| 2011 | -545 | -3,189 | -3,402 | -2,672 | -4,162 | -2,899 | -925 | -380 | -907 | 244 | 1,262 | -1,271 |
| 2012 | -238 | 2,618 | 3,041 | 2,852 | 4,178 | 3,009 | 2,066 | 1,272 | 894 | -487 | -625 | -463 |
| 2013 | -1,947 | -2,648 | -1,968 | -3,221 | -3,758 | -2,413 | -2,687 | -2,031 | -1,564 | -764 | -215 | -1,978 |
| 2014 | -2,928 | -3,865 | -3,993 | -3,012 | -2,380 | -1,531 | -437 | 678 | 1,375 | 1,212 | -523 | 3,318 |
| 2015 | 4,858 | 6,612 | 7,356 | 7,696 | 6,898 | 3,127 | 47 | -1,227 | -1,177 | -359 | 494 | -578 |
| 2016 | 787 | 993 | 621 | 1,431 | 1,544 | 1,691 | 2,089 | 1,985 | 774 | 533 | 1,267 | -1,426 |
| 2017 | -4,079 | -4,204 | -2,208 | -2,896 | -1,958 | -1,003 | -834 | -655 | -25 | -479 | -266 | -347 |
| 2018 | 959 | -1,137 | -3,233 | -3,596 | -4,119 | -2,774 | -2,144 | -3,277 | -1,867 | -1,773 | -1,132 | 891 |
| 2019 | -2,861 | -4,164 | -4,441 | -3,667 | -2,691 | -1,918 | -631 | -622 | -1,430 | -2,172 | -648 | 1,482 |
| 2020 | 6,665 | 6,326 | 4,871 | 4,230 | 5,595 | 5,911 | 4,367 | 5,628 | 4,004 | 3,375 | 2,400 | -276 |
| 2021 | -2,872 | -5,141 | -5,448 | -3,562 | -3,542 | -3,930 | -2,183 | -1,748 | -826 | 2,816 | 2,039 | 33 |
| 2022 | -1,546 | 372 | 1,570 | -788 | -495 | 538 | 676 | -468 | 153 | -9 | -1,248 | -1,336 |
| 2023 | 363 | 16 | -1,755 | 1,348 | 833 | 1,228 | -68 | 1,346 | 1,711 | -486 | 361 | 5,325 |
| 2024 | 3,606 | |||||||||||
| - = No Data Reported; -- = Not Applicable; NA = Not Available; W = Withheld to avoid disclosure of individual company data. |
| Release Date: 3/29/2024 |
| Next Release Date: 4/30/2024 |