|
Download Data (XLS File) |
|
|||||
|
|||||
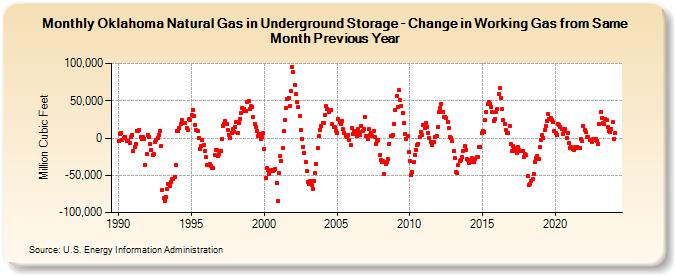
| Oklahoma Natural Gas in Underground Storage - Change in Working Gas from Same Month Previous Year (Million Cubic Feet) | |||||
| Year | Jan | Feb | Mar | Apr | May | Jun | Jul | Aug | Sep | Oct | Nov | Dec |
|---|---|---|---|---|---|---|---|---|---|---|---|---|
| 1990 | -3,932 | 5,480 | 7,289 | -2,690 | 234 | 1,959 | -4,575 | -3,502 | -6,399 | 723 | 4,670 | |
| 1991 | -18,020 | -11,848 | -7,774 | 9,453 | 9,540 | 10,851 | 1,058 | -1,981 | 846 | -1,053 | -36,391 | -20,972 |
| 1992 | 4,433 | 1,077 | -7,840 | -16,283 | -22,923 | -22,043 | -5,431 | -2,118 | 584 | 4,227 | 9,780 | -10,318 |
| 1993 | -69,197 | -80,809 | -84,489 | -78,788 | -68,176 | -61,395 | -63,858 | -58,513 | -55,195 | -55,301 | -52,876 | -36,844 |
| 1994 | 9,563 | 8,800 | 13,352 | 18,605 | 24,215 | 19,521 | 20,654 | 20,354 | 13,210 | 10,227 | 24,928 | 23,598 |
| 1995 | 30,288 | 37,375 | 29,998 | 17,738 | 10,248 | 9,688 | 629 | -14,181 | -11,065 | -2,821 | -9,883 | -17,363 |
| 1996 | -25,819 | -36,049 | -36,115 | -35,381 | -37,636 | -40,706 | -39,564 | -22,820 | -16,058 | -16,427 | -24,113 | -21,678 |
| 1997 | -17,172 | -1,270 | 16,616 | 18,803 | 22,900 | 18,201 | 11,005 | 4,367 | 66 | 7,257 | 11,899 | 8,371 |
| 1998 | 14,864 | 21,720 | 6,894 | 20,805 | 26,125 | 33,572 | 39,846 | 39,023 | 36,702 | 36,250 | 48,590 | 49,281 |
| 1999 | 39,248 | 42,598 | 41,375 | 28,271 | 18,610 | 15,408 | 9,623 | 2,286 | 5,652 | -1,978 | 1,692 | 6,704 |
| 2000 | -15,253 | -53,721 | -40,830 | -42,521 | -47,745 | -44,235 | -43,356 | -44,723 | -42,265 | -40,905 | -60,581 | -84,136 |
| 2001 | -47,476 | -23,699 | -30,342 | -12,748 | 8,858 | 24,636 | 39,741 | 51,884 | 54,358 | 43,097 | 62,502 | 95,470 |
| 2002 | 88,012 | 70,927 | 58,687 | 48,080 | 42,043 | 30,157 | 10,936 | -971 | -11,399 | -19,631 | -31,560 | -44,564 |
| 2003 | -58,619 | -61,745 | -57,984 | -63,224 | -68,116 | -57,063 | -47,052 | -34,718 | -13,050 | 2,102 | 11,351 | 16,004 |
| 2004 | 20,316 | 20,668 | 30,949 | 42,337 | 39,327 | 35,482 | 37,201 | 38,209 | 18,770 | 15,038 | 15,439 | 9,241 |
| 2005 | 7,343 | 25,053 | 21,240 | 19,235 | 23,240 | 11,445 | 6,665 | 2,642 | 1,527 | 3,757 | -2,197 | -9,702 |
| 2006 | 14,061 | 5,259 | 9,367 | 7,849 | 2,093 | 11,939 | 7,472 | 3,680 | 16,102 | 10,020 | 11,442 | 27,826 |
| 2007 | 3,340 | -1,786 | 11,618 | 4,685 | 6,129 | 2,349 | 8,799 | 1,681 | -7,807 | -3,684 | -2,877 | -22,714 |
| 2008 | -30,010 | -31,635 | -31,354 | -48,132 | -35,316 | -31,820 | -27,935 | -7,651 | 2,496 | 2,280 | 3,436 | 19,043 |
| 2009 | 37,668 | 56,485 | 41,855 | 64,077 | 51,425 | 42,517 | 34,143 | 20,217 | 5,782 | -811 | 2,949 | -18,956 |
| 2010 | -31,206 | -49,137 | -45,755 | -32,618 | -22,303 | -15,706 | -9,887 | -7,838 | 820 | 8,338 | 3,895 | 16,943 |
| 2011 | 14,055 | 20,517 | 15,276 | 7,357 | -156 | -5,166 | -9,932 | -5,619 | -5,076 | 1,473 | 3,150 | 14,904 |
| 2012 | 35,278 | 40,910 | 46,254 | 35,110 | 27,565 | 28,019 | 27,072 | 21,766 | 13,094 | 1,996 | -156 | -4,195 |
| 2013 | -17,374 | -26,574 | -45,355 | -47,299 | -36,717 | -31,136 | -28,889 | -25,398 | -17,667 | -11,320 | -15,855 | -28,743 |
| 2014 | -29,259 | -33,018 | -31,627 | -27,358 | -30,826 | -31,520 | -28,460 | -25,979 | -25,591 | -12,400 | -11,581 | 6,474 |
| 2015 | 9,858 | 8,377 | 23,801 | 35,143 | 46,216 | 47,924 | 45,857 | 41,489 | 34,288 | 22,870 | 25,764 | 34,802 |
| 2016 | 38,649 | 59,569 | 66,611 | 53,951 | 38,406 | 23,706 | 18,338 | 11,089 | 6,972 | 6,079 | 15,816 | -8,579 |
| 2017 | -18,006 | -11,118 | -13,118 | -17,768 | -19,530 | -12,154 | -16,590 | -17,151 | -16,868 | -16,875 | -25,009 | -21,474 |
| 2018 | -23,355 | -51,393 | -62,748 | -61,298 | -57,006 | -54,341 | -47,945 | -32,837 | -26,885 | -24,152 | -28,473 | -12,509 |
| 2019 | -2,296 | 3,672 | 379 | 10,447 | 16,740 | 22,363 | 32,815 | 25,743 | 27,468 | 24,062 | 21,672 | 9,698 |
| 2020 | 6,661 | 4,294 | 19,398 | 17,971 | 14,986 | 12,292 | 5,254 | 9,189 | 11,627 | -457 | 7,210 | -6,544 |
| 2021 | -12,721 | -12,497 | -15,057 | -16,094 | -12,488 | -13,173 | -11,398 | -13,341 | -12,894 | -833 | -4,005 | 16,599 |
| 2022 | 10,164 | 8,378 | 1,216 | 787 | -2,533 | -2,494 | -4,990 | -1,972 | -2,205 | -1,844 | -3,621 | -7,778 |
| 2023 | 18,577 | 34,410 | 26,875 | 19,507 | 19,074 | 25,619 | 24,221 | 14,578 | 9,099 | 8,210 | 12,508 | 21,107 |
| 2024 | -1,027 | |||||||||||
| - = No Data Reported; -- = Not Applicable; NA = Not Available; W = Withheld to avoid disclosure of individual company data. |
| Release Date: 3/29/2024 |
| Next Release Date: 4/30/2024 |