|
Download Data (XLS File) |
|
|||||
|
|||||
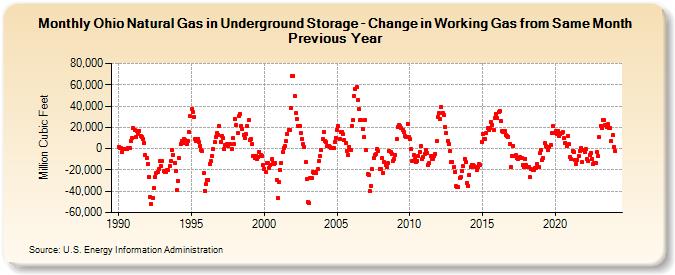
| Ohio Natural Gas in Underground Storage - Change in Working Gas from Same Month Previous Year (Million Cubic Feet) | |||||
| Year | Jan | Feb | Mar | Apr | May | Jun | Jul | Aug | Sep | Oct | Nov | Dec |
|---|---|---|---|---|---|---|---|---|---|---|---|---|
| 1990 | 1,596 | 507 | 381 | -2,931 | -46 | -596 | -311 | -234 | 178 | 167 | 7,030 | 9,898 |
| 1991 | 19,571 | 17,816 | 10,871 | 17,001 | 13,713 | 16,734 | 12,252 | 11,416 | 8,857 | 5,742 | -6,023 | -8,607 |
| 1992 | -14,527 | -26,506 | -45,308 | -51,996 | -46,282 | -36,996 | -26,224 | -22,672 | -22,086 | -18,888 | -11,177 | -16,353 |
| 1993 | -11,967 | -21,375 | -21,809 | -21,634 | -20,069 | -20,488 | -16,719 | -11,806 | -1,499 | -5,717 | -13,058 | -21,422 |
| 1994 | -39,036 | -30,048 | -9,070 | 4,162 | 7,033 | 5,081 | 8,939 | 7,976 | 3,961 | 7,543 | 16,019 | 30,397 |
| 1995 | 36,925 | 34,571 | 29,611 | 9,077 | 7,499 | 9,345 | 6,077 | 2,682 | -942 | -2,597 | -22,632 | -39,593 |
| 1996 | -33,505 | -29,554 | -29,031 | -14,069 | -11,964 | -6,563 | -769 | 5,919 | 10,693 | 14,789 | 13,258 | 21,252 |
| 1997 | 6,638 | 12,180 | 9,565 | -449 | 3,679 | 4,111 | 2,361 | 4,131 | 3,987 | -363 | 9,667 | 4,116 |
| 1998 | 27,797 | 21,956 | 14,301 | 30,392 | 32,587 | 21,140 | 18,311 | 13,026 | 9,738 | 13,773 | 21,360 | 26,553 |
| 1999 | 8,291 | 9,161 | 4,162 | -6,526 | -8,891 | -6,835 | -10,084 | -7,561 | -2,953 | -6,199 | -6,800 | -14,990 |
| 2000 | -18,700 | -22,178 | -13,484 | -13,211 | -17,927 | -15,292 | -10,145 | -13,195 | -14,576 | -13,765 | -29,081 | -46,364 |
| 2001 | -31,207 | -20,153 | -13,388 | -3,417 | 385 | 2,195 | 6,906 | 13,824 | 17,523 | 17,154 | 38,084 | 67,992 |
| 2002 | 68,212 | 49,301 | 33,487 | 27,971 | 21,616 | 21,567 | 14,471 | 9,480 | 4,354 | 1,462 | -12,966 | -28,762 |
| 2003 | -50,380 | -51,062 | -27,391 | -27,319 | -22,309 | -23,127 | -22,070 | -22,519 | -19,331 | -11,329 | -6,994 | -1,459 |
| 2004 | 8,748 | 15,927 | 7,630 | 6,165 | 2,399 | 2,763 | 1,517 | 164 | 538 | 631 | 6,328 | 10,384 |
| 2005 | 17,923 | 21,082 | 8,946 | 15,830 | 16,011 | 13,315 | 8,375 | 5,198 | -2,082 | -5,493 | 1,875 | -1,341 |
| 2006 | 21,715 | 26,513 | 49,908 | 55,672 | 57,594 | 45,840 | 36,915 | 27,358 | 26,784 | 18,881 | 10,791 | 26,630 |
| 2007 | -1,609 | -23,913 | -24,448 | -40,164 | -34,848 | -19,500 | -8,661 | -6,079 | -5,352 | -328 | -2,129 | -18,840 |
| 2008 | -18,860 | -8,878 | -22,491 | -12,458 | -15,452 | -17,433 | -13,882 | -2,147 | -2,827 | -5,215 | -11,929 | -9,989 |
| 2009 | -5,605 | 8,888 | 20,276 | 22,427 | 20,820 | 19,370 | 17,912 | 15,422 | 12,346 | 11,220 | 23,437 | 11,425 |
| 2010 | 8,642 | -667 | -11,497 | -5,741 | -10,036 | -12,968 | -11,251 | -7,282 | -3,050 | 2,323 | -10,113 | -7,856 |
| 2011 | -4,946 | -941 | -4,470 | -15,093 | -13,497 | -6,898 | -9,282 | -10,035 | -6,686 | -4,712 | 6,883 | 29,845 |
| 2012 | 33,113 | 27,694 | 39,014 | 33,865 | 32,062 | 20,408 | 14,612 | 7,010 | 3,974 | -2,543 | -12,638 | -12,529 |
| 2013 | -17,335 | -21,682 | -35,347 | -36,301 | -35,563 | -27,421 | -26,969 | -21,399 | -16,705 | -9,445 | -12,561 | -31,819 |
| 2014 | -34,767 | -24,318 | -17,042 | -15,000 | -14,876 | -16,256 | -16,911 | -19,643 | -17,430 | -14,861 | -15,129 | 6,266 |
| 2015 | 13,838 | 8,777 | 9,193 | 14,899 | 19,153 | 17,610 | 19,848 | 24,832 | 22,337 | 17,771 | 28,692 | 32,993 |
| 2016 | 28,880 | 34,265 | 35,826 | 26,079 | 16,213 | 15,810 | 16,423 | 12,441 | 12,192 | 11,207 | 4,503 | -17,298 |
| 2017 | -6,566 | 2,976 | -7,081 | -6,344 | -9,178 | -9,244 | -8,950 | -8,275 | -8,324 | -15,156 | -17,084 | -9,426 |
| 2018 | -15,538 | -17,343 | -16,977 | -26,943 | -19,319 | -19,641 | -19,791 | -18,310 | -18,158 | -14,626 | -16,817 | -4,531 |
| 2019 | -924 | -10,574 | -8,380 | 5,137 | 2,236 | 1,539 | -1,370 | 1,398 | 3,565 | 14,684 | 21,165 | 15,049 |
| 2020 | 16,717 | 13,559 | 16,380 | 11,541 | 13,482 | 15,003 | 15,572 | 9,573 | 5,291 | 2,244 | 12,341 | 4,284 |
| 2021 | -7,982 | -9,932 | -2,095 | -3,103 | -10,452 | -14,190 | -10,640 | -6,981 | -1,757 | 469 | -12,952 | -1,143 |
| 2022 | -2,872 | -644 | -9,845 | -12,018 | -5,560 | -3,624 | -9,866 | -14,687 | -13,145 | -13,251 | -3,158 | -7,293 |
| 2023 | 10,707 | 21,589 | 19,382 | 27,353 | 26,861 | 21,838 | 20,212 | 22,795 | 19,057 | 19,003 | 7,027 | 12,558 |
| 2024 | 1,996 | -2,461 | 8,801 | 14,906 | 13,857 | 14,111 | ||||||
| - = No Data Reported; -- = Not Applicable; NA = Not Available; W = Withheld to avoid disclosure of individual company data. |
| Release Date: 8/30/2024 |
| Next Release Date: 9/30/2024 |