|
Download Data (XLS File) |
|
|||||
|
|||||
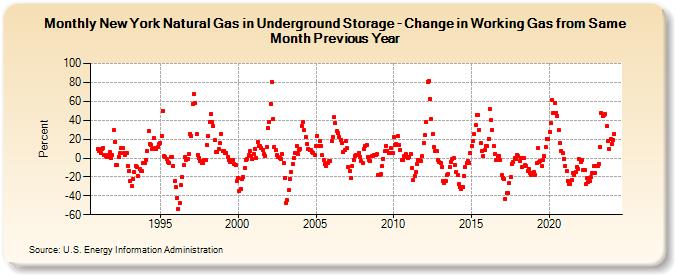
| New York Natural Gas in Underground Storage - Change in Working Gas from Same Month Previous Year (Percent) | |||||
| Year | Jan | Feb | Mar | Apr | May | Jun | Jul | Aug | Sep | Oct | Nov | Dec |
|---|---|---|---|---|---|---|---|---|---|---|---|---|
| 1991 | 9.4 | 7.6 | 5.1 | 9.8 | 10.8 | 3.2 | 1.9 | 1.0 | 3.5 | 6.1 | -0.1 | 3.5 |
| 1992 | 29.1 | 17.2 | -7.6 | -7.9 | 1.5 | 5.0 | 10.3 | 10.6 | 5.4 | 3.2 | 5.6 | -8.1 |
| 1993 | -13.6 | -24.4 | -30.1 | -22.5 | -15.0 | -8.4 | -9.2 | -18.9 | -12.1 | -13.4 | -14.1 | -5.6 |
| 1994 | -5.8 | -1.8 | 7.8 | 29.0 | 14.9 | 14.1 | 9.6 | 21.1 | 10.7 | 9.5 | 11.2 | 14.4 |
| 1995 | 15.8 | 23.8 | 49.4 | 1.6 | 0.9 | -1.4 | -4.4 | -4.8 | 1.1 | 1.5 | -8.6 | -24.7 |
| 1996 | -31.2 | -42.1 | -53.7 | -47.7 | -29.0 | -20.4 | -7.4 | 0.8 | -1.8 | -1.2 | 3.8 | 25.9 |
| 1997 | 23.3 | 57.3 | 67.6 | 58.2 | 25.1 | 3.5 | -0.3 | -3.1 | -5.1 | -5.3 | -2.6 | -2.0 |
| 1998 | 13.7 | 23.0 | 38.5 | 46.2 | 37.9 | 33.6 | 18.6 | 6.4 | 6.6 | 9.4 | 15.5 | 25.9 |
| 1999 | 7.0 | 7.3 | 5.0 | 5.6 | 1.1 | -1.7 | -4.7 | -2.5 | -2.3 | -6.7 | -7.7 | -24.6 |
| 2000 | -21.5 | -34.8 | -32.8 | -22.7 | -19.7 | -10.7 | -2.2 | -0.6 | 2.9 | 7.2 | 2.2 | -1.5 |
| 2001 | 4.4 | 9.3 | 0.2 | 17.1 | 12.5 | 12.5 | 10.8 | 8.5 | 4.0 | 2.5 | 11.7 | 31.4 |
| 2002 | 38.4 | 57.6 | 80.6 | 41.6 | 11.7 | 8.6 | 3.1 | 0.6 | 0.5 | -1.4 | 3.9 | -5.3 |
| 2003 | -20.9 | -47.1 | -44.8 | -34.0 | -22.1 | -14.4 | -6.5 | -0.2 | 5.6 | 13.2 | 4.2 | 8.9 |
| 2004 | 9.9 | 34.1 | 38.1 | 29.2 | 22.3 | 14.6 | 9.9 | 8.7 | 8.2 | 6.4 | 5.6 | 2.7 |
| 2005 | 12.3 | 23.6 | 12.2 | 18.2 | 12.6 | 2.8 | -1.9 | -6.2 | -8.3 | -5.5 | -3.6 | -3.5 |
| 2006 | 18.1 | 22.5 | 43.1 | 36.6 | 28.2 | 26.0 | 22.0 | 18.7 | 15.5 | 6.2 | 8.0 | 17.9 |
| 2007 | 10.1 | -9.7 | -14.0 | -21.2 | -8.5 | -2.1 | 2.3 | 3.3 | 3.5 | 5.7 | 0.7 | -3.7 |
| 2008 | -5.3 | 9.2 | 12.8 | 13.5 | 1.4 | -2.4 | -3.3 | 2.0 | 2.6 | 3.1 | 2.7 | 3.9 |
| 2009 | -17.8 | -17.7 | -17.2 | -8.5 | -0.9 | 7.0 | 12.8 | 7.8 | 5.8 | 5.7 | 10.3 | 5.5 |
| 2010 | 22.7 | 13.3 | 15.1 | 22.9 | 14.1 | 8.6 | -1.9 | -2.0 | 1.7 | 3.8 | 1.0 | 0.0 |
| 2011 | 1.2 | 4.7 | -10.3 | -23.1 | -18.8 | -14.8 | -6.3 | -2.1 | -2.6 | -3.4 | 1.8 | 16.2 |
| 2012 | 23.9 | 37.8 | 80.6 | 81.5 | 62.6 | 41.0 | 25.9 | 11.9 | 7.9 | 7.4 | -2.0 | -4.1 |
| 2013 | -5.0 | -9.5 | -24.4 | -26.0 | -24.4 | -18.0 | -17.0 | -9.1 | -4.6 | -1.1 | 0.0 | -6.9 |
| 2014 | -15.0 | -17.9 | -28.0 | -30.6 | -32.8 | -30.2 | -19.0 | -9.4 | -5.2 | -3.5 | -5.0 | 5.5 |
| 2015 | 13.2 | 18.1 | 24.9 | 34.4 | 46.0 | 45.3 | 30.0 | 15.5 | 7.2 | 1.9 | 8.8 | 12.5 |
| 2016 | 12.2 | 20.4 | 51.6 | 40.6 | 29.6 | 12.2 | 4.0 | -2.1 | 1.8 | 2.5 | -1.7 | -18.4 |
| 2017 | -20.8 | -22.1 | -43.3 | -37.1 | -36.7 | -26.6 | -20.3 | -6.0 | -3.9 | -0.3 | -1.3 | 3.7 |
| 2018 | 1.8 | -3.1 | 0.5 | -9.6 | 0.4 | -7.2 | -8.2 | -13.9 | -11.2 | -15.4 | -17.7 | -15.5 |
| 2019 | -14.6 | -17.6 | -5.6 | 10.3 | -4.0 | -3.7 | -8.2 | -1.8 | 1.7 | 11.3 | 20.5 | 19.8 |
| 2020 | 28.0 | 36.7 | 61.4 | 47.5 | 57.8 | 47.7 | 44.6 | 29.1 | 15.4 | 7.7 | 5.1 | -0.6 |
| 2021 | -8.0 | -14.0 | -24.0 | -27.6 | -27.0 | -23.2 | -15.4 | -18.1 | -15.1 | -9.2 | -11.4 | -1.3 |
| 2022 | -4.2 | -2.6 | -12.2 | -12.3 | -27.7 | -20.8 | -25.8 | -24.8 | -20.4 | -16.2 | -8.8 | -15.8 |
| 2023 | -8.5 | -8.1 | -6.2 | 11.9 | 48.0 | 44.4 | 46.0 | 46.4 | 33.8 | 18.1 | 10.0 | 20.0 |
| 2024 | 14.8 | 18.6 | 25.7 | 11.0 | 3.9 | -1.7 | ||||||
| - = No Data Reported; -- = Not Applicable; NA = Not Available; W = Withheld to avoid disclosure of individual company data. |
| Release Date: 8/30/2024 |
| Next Release Date: 9/30/2024 |