|
Download Data (XLS File) |
|
|||||
|
|||||
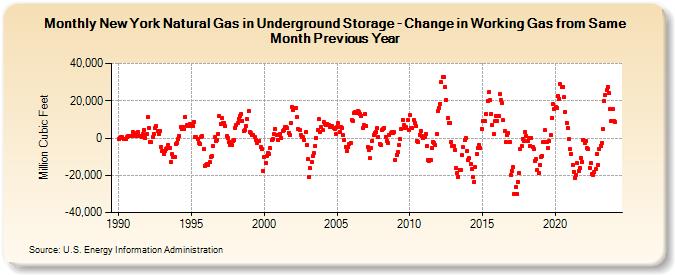
| New York Natural Gas in Underground Storage - Change in Working Gas from Same Month Previous Year (Million Cubic Feet) | |||||
| Year | Jan | Feb | Mar | Apr | May | Jun | Jul | Aug | Sep | Oct | Nov | Dec |
|---|---|---|---|---|---|---|---|---|---|---|---|---|
| 1990 | -484 | -13 | 300 | 294 | -712 | -349 | -288 | 393 | 1,101 | 972 | 1,011 | 1,114 |
| 1991 | 3,318 | 2,144 | 1,258 | 2,592 | 3,476 | 1,343 | 977 | 614 | 2,324 | 4,252 | -55 | 2,063 |
| 1992 | 11,224 | 5,214 | -1,963 | -2,306 | 527 | 2,182 | 5,330 | 6,430 | 3,719 | 2,374 | 3,894 | -4,958 |
| 1993 | -6,762 | -8,650 | -7,154 | -6,031 | -5,432 | -3,859 | -5,235 | -12,631 | -8,772 | -10,235 | -10,273 | -3,149 |
| 1994 | -2,517 | -470 | 1,289 | 6,015 | 4,590 | 5,915 | 4,963 | 11,457 | 6,824 | 6,269 | 6,981 | 7,667 |
| 1995 | 6,381 | 6,272 | 8,818 | 437 | 309 | -648 | -2,521 | -3,178 | 786 | 1,081 | -5,984 | -14,997 |
| 1996 | -14,592 | -13,733 | -14,382 | -13,026 | -10,421 | -9,742 | -4,162 | 368 | -1,791 | -848 | 2,368 | 11,761 |
| 1997 | 7,508 | 10,799 | 8,311 | 8,249 | 6,352 | 1,326 | -154 | -1,937 | -3,550 | -3,837 | -1,706 | -1,132 |
| 1998 | 5,433 | 6,813 | 7,936 | 10,358 | 12,008 | 13,007 | 9,333 | 3,892 | 4,386 | 6,475 | 9,967 | 14,608 |
| 1999 | 3,184 | 2,651 | 1,420 | 1,821 | 463 | -862 | -2,782 | -1,641 | -1,602 | -5,026 | -5,676 | -17,512 |
| 2000 | -10,399 | -13,623 | -9,834 | -7,861 | -8,724 | -5,445 | -1,232 | -360 | 1,998 | 5,045 | 1,478 | -794 |
| 2001 | 1,660 | 2,361 | 48 | 3,889 | 4,426 | 5,677 | 5,956 | 5,331 | 2,855 | 1,848 | 8,190 | 16,577 |
| 2002 | 15,223 | 16,058 | 16,269 | 11,062 | 4,653 | 4,397 | 1,876 | 399 | 350 | -1,062 | 3,046 | -3,683 |
| 2003 | -11,500 | -20,682 | -16,321 | -12,795 | -9,826 | -8,001 | -4,091 | -122 | 4,175 | 9,993 | 3,423 | 5,811 |
| 2004 | 4,284 | 8,537 | 7,661 | 7,247 | 7,753 | 6,952 | 5,828 | 5,979 | 6,461 | 5,483 | 4,711 | 1,944 |
| 2005 | 5,883 | 7,906 | 3,380 | 5,828 | 5,364 | 1,539 | -1,245 | -4,606 | -7,046 | -4,980 | -3,200 | -2,563 |
| 2006 | 9,670 | 9,319 | 13,428 | 13,871 | 13,499 | 14,559 | 14,020 | 13,051 | 12,061 | 5,358 | 6,912 | 12,703 |
| 2007 | 6,371 | -4,903 | -6,242 | -10,979 | -5,193 | -1,469 | 1,749 | 2,752 | 3,150 | 5,187 | 661 | -3,097 |
| 2008 | -3,656 | 4,242 | 4,893 | 5,530 | 805 | -1,658 | -2,622 | 1,744 | 2,431 | 3,046 | 2,557 | 3,173 |
| 2009 | -11,731 | -8,859 | -7,426 | -3,947 | -536 | 4,722 | 9,803 | 6,804 | 5,517 | 5,714 | 9,881 | 4,565 |
| 2010 | 12,304 | 5,466 | 5,403 | 9,708 | 7,937 | 6,220 | -1,653 | -1,912 | 1,667 | 3,999 | 1,060 | -22 |
| 2011 | 790 | 2,208 | -4,253 | -12,017 | -12,083 | -11,568 | -5,356 | -1,976 | -2,685 | -3,751 | 1,976 | 14,320 |
| 2012 | 16,118 | 18,475 | 29,814 | 32,663 | 32,728 | 27,408 | 20,624 | 10,742 | 7,916 | 7,794 | -2,190 | -4,169 |
| 2013 | -4,187 | -6,403 | -16,309 | -18,906 | -20,736 | -16,948 | -16,993 | -9,221 | -4,982 | -1,230 | -39 | -6,827 |
| 2014 | -11,859 | -10,928 | -14,152 | -16,487 | -21,070 | -23,355 | -15,804 | -8,669 | -5,369 | -3,903 | -5,363 | 4,995 |
| 2015 | 8,871 | 9,086 | 9,045 | 12,844 | 19,859 | 24,436 | 20,255 | 12,926 | 7,016 | 2,046 | 8,934 | 12,071 |
| 2016 | 9,299 | 12,065 | 23,421 | 20,398 | 18,652 | 9,524 | 3,522 | -2,056 | 1,858 | 2,777 | -1,871 | -19,993 |
| 2017 | -17,812 | -15,704 | -29,803 | -26,165 | -29,998 | -23,380 | -18,523 | -5,649 | -4,171 | -325 | -1,385 | 3,254 |
| 2018 | 1,253 | -1,701 | 198 | -4,262 | 228 | -4,630 | -5,967 | -12,281 | -11,474 | -17,367 | -19,032 | -14,215 |
| 2019 | -10,072 | -9,469 | -2,204 | 4,137 | -2,069 | -2,211 | -5,500 | -1,365 | 1,505 | 10,766 | 18,089 | 15,389 |
| 2020 | 16,526 | 16,268 | 22,708 | 21,040 | 28,827 | 27,477 | 27,293 | 21,746 | 14,230 | 8,195 | 5,397 | -569 |
| 2021 | -6,059 | -8,512 | -14,327 | -18,050 | -21,268 | -19,749 | -13,634 | -17,448 | -16,089 | -10,503 | -12,769 | -1,199 |
| 2022 | -2,880 | -1,372 | -5,535 | -5,800 | -15,924 | -13,574 | -19,301 | -19,606 | -18,467 | -16,848 | -8,703 | -14,405 |
| 2023 | -5,635 | -4,122 | -2,484 | 4,952 | 19,922 | 22,964 | 25,577 | 27,595 | 24,288 | 15,773 | 9,053 | 15,336 |
| 2024 | 9,026 | |||||||||||
| - = No Data Reported; -- = Not Applicable; NA = Not Available; W = Withheld to avoid disclosure of individual company data. |
| Release Date: 3/29/2024 |
| Next Release Date: 4/30/2024 |