|
Download Data (XLS File) |
|
|||||
|
|||||
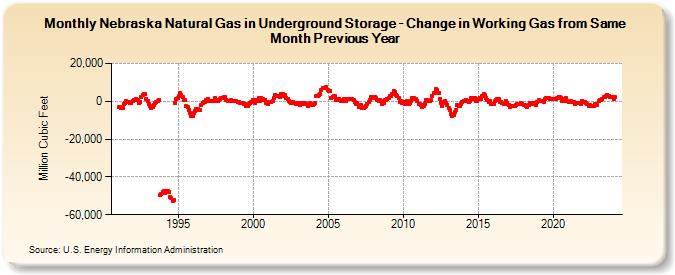
| Nebraska Natural Gas in Underground Storage - Change in Working Gas from Same Month Previous Year (Million Cubic Feet) | |||||
| Year | Jan | Feb | Mar | Apr | May | Jun | Jul | Aug | Sep | Oct | Nov | Dec |
|---|---|---|---|---|---|---|---|---|---|---|---|---|
| 1991 | -3,131 | -3,119 | -3,529 | -3,306 | -1,630 | -1,017 | 244 | -266 | -458 | -1,071 | -1,072 | 157 |
| 1992 | 482 | 508 | 1,184 | 660 | -762 | -277 | 2,037 | 3,311 | 3,592 | 3,600 | 1,413 | 350 |
| 1993 | -1,474 | -2,431 | -3,424 | -3,068 | -1,752 | -1,058 | -532 | 116 | 439 | -49,834 | -49,012 | -47,951 |
| 1994 | -47,626 | -48,394 | -47,215 | -47,224 | -48,033 | -50,455 | -51,409 | -52,919 | -52,304 | -800 | 1,142 | 1,513 |
| 1995 | 2,587 | 4,325 | 3,253 | 2,095 | 601 | 567 | -2,624 | -2,794 | -4,534 | -6,232 | -8,001 | -7,590 |
| 1996 | -6,063 | -5,068 | -4,138 | -3,940 | -4,583 | -4,643 | -1,943 | -843 | -484 | -287 | 854 | 1,464 |
| 1997 | 0 | 0 | 0 | 0 | 0 | 1,562 | 504 | 191 | 538 | 1,176 | 1,506 | 1,545 |
| 1998 | 2,036 | 2,185 | 854 | 57 | 233 | -36 | 685 | 336 | 110 | 406 | -4 | -275 |
| 1999 | -597 | -684 | -932 | -919 | -1,529 | -1,360 | -2,634 | -2,245 | -1,377 | -1,085 | -251 | 473 |
| 2000 | 152 | -719 | 577 | 0 | 1,594 | 102 | 1,645 | 1,079 | 512 | 587 | -1,107 | -1,501 |
| 2001 | -373 | -279 | -622 | -18 | 1,812 | 3,562 | 2,836 | 2,762 | 2,847 | 2,477 | 3,918 | 3,973 |
| 2002 | 2,597 | 3,136 | 1,893 | 1,078 | 206 | -149 | -726 | -385 | -713 | -1,074 | -1,174 | -1,104 |
| 2003 | -1,007 | -1,840 | -715 | -728 | -1,227 | -824 | -1,338 | -2,583 | -2,104 | -1,104 | -1,984 | -1,836 |
| 2004 | -1,435 | -1,115 | 2,645 | 2,869 | 3,300 | 3,625 | 5,882 | 6,910 | 7,015 | 7,061 | 7,687 | 6,209 |
| 2005 | 5,362 | 5,685 | 1,968 | 2,446 | 2,609 | 2,545 | 656 | 1,027 | 1,127 | 489 | 365 | 146 |
| 2006 | 1,114 | 169 | 283 | 1,328 | 1,446 | 1,196 | 1,467 | 1,062 | 632 | -474 | -1,199 | -660 |
| 2007 | -3,011 | -3,210 | -2,001 | -3,571 | -3,400 | -3,259 | -2,756 | -1,173 | -574 | 920 | 2,149 | 1,770 |
| 2008 | 2,331 | 2,528 | 1,527 | 482 | 391 | 531 | 242 | -1,674 | -1,160 | 523 | 642 | 1,145 |
| 2009 | 1,611 | 2,798 | 2,543 | 4,095 | 5,621 | 4,958 | 3,319 | 2,794 | 1,520 | -147 | 120 | -795 |
| 2010 | -569 | -1,310 | -1,032 | -9 | -1,489 | -759 | 295 | 1,909 | 1,654 | 1,333 | 972 | 114 |
| 2011 | -1,220 | -1,646 | -1,952 | -2,974 | -2,397 | -1,237 | 546 | 508 | -41 | -81 | 516 | 2,884 |
| 2012 | 4,262 | 4,616 | 6,280 | 5,994 | 4,470 | 1,457 | -832 | -2,244 | -158 | 3 | -853 | -1,945 |
| 2013 | -3,748 | -4,591 | -6,757 | -7,758 | -7,383 | -5,884 | -4,527 | -2,113 | -2,434 | -2,490 | -1,483 | -480 |
| 2014 | 300 | 188 | 604 | 193 | -519 | 278 | 1,496 | 1,225 | 1,545 | 1,561 | -3 | 251 |
| 2015 | 984 | 1,598 | 1,433 | 2,611 | 3,637 | 3,171 | 1,659 | 713 | -290 | 328 | -1,332 | -1,425 |
| 2016 | -1,224 | 5 | 778 | 990 | 968 | -359 | -285 | -1,155 | -1,320 | -1,342 | 316 | -875 |
| 2017 | -1,931 | -2,791 | -2,607 | -2,258 | -2,341 | -2,539 | -1,757 | -1,284 | -1,211 | -1,679 | -726 | -1,308 |
| 2018 | -1,762 | -2,210 | -2,499 | -3,006 | -1,961 | -892 | -1,192 | -918 | -724 | -1,491 | -2,050 | -506 |
| 2019 | 575 | 370 | 61 | 193 | -317 | 1,027 | 1,583 | 1,964 | 1,593 | 1,382 | 1,399 | 1,313 |
| 2020 | 1,293 | 1,374 | 1,095 | 1,645 | 2,326 | 2,437 | 1,959 | 107 | 394 | 1,313 | 1,659 | 104 |
| 2021 | -290 | -205 | 17 | -474 | -322 | -1,174 | -1,073 | -937 | -1,114 | -1,001 | -1,675 | 301 |
| 2022 | -166 | -253 | -1,039 | -1,373 | -2,419 | -1,966 | -2,531 | -2,707 | -2,286 | -1,655 | -1,557 | -1,874 |
| 2023 | 100 | 623 | 591 | 1,463 | 2,256 | 2,037 | 2,728 | 3,524 | 2,875 | 2,257 | 2,461 | 2,399 |
| 2024 | 1,318 | 2,054 | ||||||||||
| - = No Data Reported; -- = Not Applicable; NA = Not Available; W = Withheld to avoid disclosure of individual company data. |
| Release Date: 4/30/2024 |
| Next Release Date: 5/31/2024 |