|
Download Data (XLS File) |
|
|||||
|
|||||
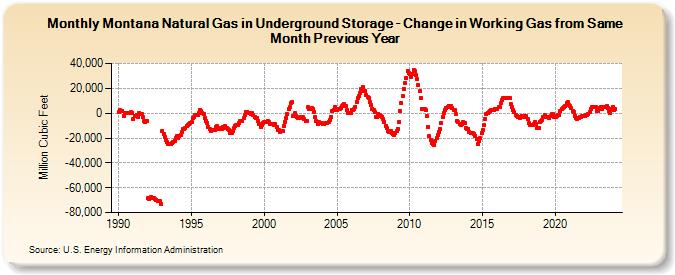
| Montana Natural Gas in Underground Storage - Change in Working Gas from Same Month Previous Year (Million Cubic Feet) | |||||
| Year | Jan | Feb | Mar | Apr | May | Jun | Jul | Aug | Sep | Oct | Nov | Dec |
|---|---|---|---|---|---|---|---|---|---|---|---|---|
| 1990 | 705 | 2,167 | 1,643 | 1,813 | -2,403 | 355 | 272 | -26 | 131 | 59 | 561 | 542 |
| 1991 | -4,514 | -2,633 | -2,648 | -1,702 | -3,097 | 151 | -280 | -908 | -3,437 | -6,076 | -7,308 | -6,042 |
| 1992 | -68,442 | -68,852 | -67,958 | -67,769 | -67,999 | -68,527 | -69,209 | -69,883 | -70,428 | -70,404 | -71,019 | -73,067 |
| 1993 | -14,437 | -17,034 | -19,377 | -21,219 | -23,373 | -24,811 | -24,628 | -25,093 | -24,213 | -22,944 | -22,384 | -19,989 |
| 1994 | -18,713 | -19,954 | -18,358 | -17,429 | -15,333 | -12,802 | -12,658 | -11,874 | -10,555 | -9,434 | -8,353 | -7,819 |
| 1995 | -7,494 | -3,827 | -3,353 | -1,774 | -1,433 | -1,101 | 464 | 2,584 | 1,908 | 321 | -1,020 | -3,599 |
| 1996 | -6,352 | -7,794 | -10,982 | -12,425 | -14,484 | -13,837 | -13,490 | -13,192 | -10,766 | -10,545 | -12,251 | -12,502 |
| 1997 | -11,898 | -12,444 | -11,156 | -12,320 | -10,693 | -11,846 | -12,399 | -13,563 | -15,594 | -16,274 | -14,281 | -11,946 |
| 1998 | -10,717 | -9,288 | -9,715 | -8,129 | -6,404 | -6,013 | -6,428 | -4,243 | -1,494 | 1,053 | 1,207 | 462 |
| 1999 | -24 | -845 | -238 | -1,343 | -3,345 | -3,585 | -4,086 | -6,068 | -8,835 | -10,887 | -9,471 | -8,231 |
| 2000 | -7,401 | -7,217 | -6,971 | -6,264 | -7,354 | -8,683 | -8,455 | -8,744 | -9,274 | -8,781 | -11,309 | -13,803 |
| 2001 | -13,933 | -15,247 | -14,714 | -14,092 | -10,668 | -7,090 | -3,589 | -876 | 3,034 | 4,633 | 7,859 | 9,136 |
| 2002 | -1,973 | -234 | -2,206 | -2,919 | -3,942 | -4,061 | -2,995 | -2,776 | -3,338 | -4,980 | -6,404 | -5,988 |
| 2003 | 4,975 | 3,009 | 2,982 | 3,909 | 3,178 | 1,012 | -3,235 | -6,352 | -9,012 | -7,307 | -8,021 | -7,926 |
| 2004 | -8,871 | -8,767 | -7,799 | -8,068 | -7,596 | -6,936 | -5,363 | -2,922 | 1,368 | 2,927 | 5,007 | 3,264 |
| 2005 | 2,699 | 3,644 | 3,367 | 4,334 | 5,445 | 6,741 | 6,995 | 5,818 | 2,216 | 111 | -143 | 120 |
| 2006 | 2,916 | 2,470 | 2,967 | 5,352 | 9,172 | 11,918 | 13,969 | 16,155 | 19,599 | 21,013 | 18,124 | 17,896 |
| 2007 | 14,824 | 13,349 | 12,464 | 9,253 | 6,423 | 3,733 | 2,211 | 715 | -2,727 | -3,470 | -553 | -1,284 |
| 2008 | -2,428 | -2,863 | -4,400 | -7,072 | -10,050 | -12,296 | -14,265 | -14,985 | -14,091 | -15,609 | -16,397 | -17,204 |
| 2009 | -16,269 | -14,032 | -12,539 | -6,844 | 1,623 | 8,340 | 14,006 | 19,853 | 24,630 | 28,451 | 33,721 | 32,634 |
| 2010 | 31,728 | 29,148 | 31,647 | 35,037 | 33,741 | 30,382 | 27,200 | 22,736 | 17,532 | 12,233 | 3,532 | 3,718 |
| 2011 | 3,102 | 2,166 | -2,516 | -10,755 | -18,630 | -21,623 | -23,713 | -25,096 | -25,337 | -22,520 | -20,099 | -17,556 |
| 2012 | -15,523 | -12,927 | -8,054 | -2,937 | 125 | 2,590 | 3,826 | 4,824 | 6,062 | 5,247 | 5,648 | 4,323 |
| 2013 | 2,842 | 2,404 | -928 | -6,346 | -7,421 | -9,007 | -9,316 | -8,606 | -6,843 | -8,269 | -11,616 | -12,926 |
| 2014 | -12,629 | -14,814 | -15,650 | -15,904 | -16,168 | -16,776 | -17,974 | -20,915 | -24,510 | -22,108 | -20,279 | -16,007 |
| 2015 | -13,575 | -9,545 | -4,525 | -884 | -101 | 876 | 1,409 | 2,782 | 2,931 | 2,239 | 3,471 | 3,197 |
| 2016 | 3,391 | 4,649 | 5,247 | 7,840 | 10,497 | 12,277 | 12,152 | 12,172 | 12,262 | 11,994 | 12,049 | 7,364 |
| 2017 | 4,683 | 2,698 | 741 | -1,199 | -2,336 | -3,061 | -2,763 | -3,835 | -1,935 | -1,905 | -3,435 | -2,549 |
| 2018 | -2,493 | -4,919 | -7,932 | -9,493 | -9,475 | -9,635 | -9,022 | -6,948 | -8,589 | -11,879 | -11,549 | -7,230 |
| 2019 | -6,027 | -5,790 | -3,084 | -1,705 | -3,074 | -2,873 | -3,257 | -4,099 | -2,589 | -985 | -947 | -2,754 |
| 2020 | -3,039 | -2,146 | -1,760 | -1,226 | 1,684 | 3,213 | 4,258 | 4,750 | 5,632 | 8,563 | 8,706 | 6,593 |
| 2021 | 5,451 | 4,084 | 2,013 | 719 | -2,034 | -4,097 | -5,057 | -3,940 | -3,271 | -3,237 | -2,337 | -2,153 |
| 2022 | -2,263 | -1,663 | -1,200 | -909 | 1,278 | 3,449 | 4,885 | 5,147 | 4,568 | 4,604 | 2,000 | 1,842 |
| 2023 | 4,252 | 4,733 | 3,313 | 4,574 | 4,972 | 5,053 | 5,705 | 3,896 | 1,593 | 371 | 3,007 | 5,021 |
| 2024 | 2,706 | |||||||||||
| - = No Data Reported; -- = Not Applicable; NA = Not Available; W = Withheld to avoid disclosure of individual company data. |
| Release Date: 3/29/2024 |
| Next Release Date: 4/30/2024 |