|
Download Data (XLS File) |
|
|||||
|
|||||
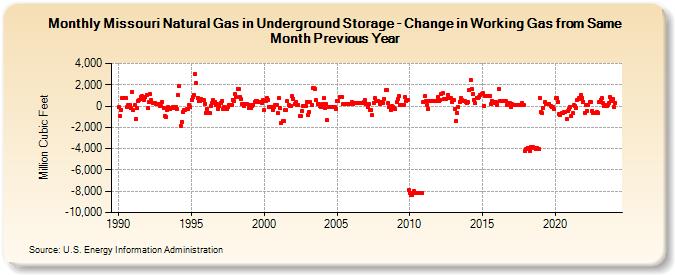
| Missouri Natural Gas in Underground Storage - Change in Working Gas from Same Month Previous Year (Million Cubic Feet) | |||||
| Year | Jan | Feb | Mar | Apr | May | Jun | Jul | Aug | Sep | Oct | Nov | Dec |
|---|---|---|---|---|---|---|---|---|---|---|---|---|
| 1990 | -114 | -943 | -336 | 775 | 774 | 774 | 773 | -107 | 103 | 55 | -146 | 1,291 |
| 1991 | -410 | 79 | -1,227 | -201 | 487 | 592 | 893 | 913 | 620 | 617 | 807 | 1,083 |
| 1992 | -216 | 381 | 1,107 | 542 | 286 | 333 | 304 | 220 | 216 | 189 | -18 | -13 |
| 1993 | 393 | -220 | -975 | -996 | -374 | -69 | -233 | -135 | -136 | -112 | -226 | -70 |
| 1994 | -245 | 1,036 | 1,842 | -1,862 | -1,456 | -552 | -338 | -348 | -285 | -294 | 58 | -85 |
| 1995 | 598 | 848 | 1,085 | 2,969 | 2,136 | 772 | 445 | 487 | 680 | 597 | 533 | 197 |
| 1996 | -642 | -262 | -655 | -677 | 21 | 290 | 541 | 398 | 140 | 226 | -244 | 12 |
| 1997 | 309 | 461 | -279 | -42 | -162 | -311 | -119 | 55 | 90 | 95 | 607 | 453 |
| 1998 | 1,121 | 858 | 1,610 | 1,619 | 879 | 624 | 184 | 8 | 182 | 175 | 172 | -174 |
| 1999 | 114 | -220 | 53 | 127 | 364 | 501 | 504 | 364 | 358 | 355 | 325 | 557 |
| 2000 | -394 | 498 | 745 | 616 | -56 | -70 | -81 | -360 | -57 | 91 | 108 | -662 |
| 2001 | 714 | -214 | -1,554 | -1,400 | -1,441 | -359 | -355 | 450 | 88 | -18 | 47 | 904 |
| 2002 | 673 | 228 | 381 | 115 | 122 | -955 | -959 | -453 | -21 | 25 | 42 | 414 |
| 2003 | -828 | -558 | 361 | 131 | 1,665 | 1,651 | 1,646 | 524 | 220 | 161 | 49 | -42 |
| 2004 | 193 | 719 | -218 | 198 | -1,348 | -124 | -106 | -94 | -112 | -98 | -60 | -298 |
| 2005 | 500 | 459 | 826 | 841 | 853 | 189 | 181 | 182 | 194 | 181 | 190 | 211 |
| 2006 | 366 | 148 | 327 | 327 | 327 | 270 | 274 | 277 | 279 | 277 | 341 | 548 |
| 2007 | 214 | -81 | 215 | -381 | -378 | -862 | 324 | 727 | 491 | 496 | 453 | 225 |
| 2008 | 344 | 356 | 293 | 667 | 1,478 | 1,474 | 286 | -125 | -368 | -35 | -64 | -201 |
| 2009 | -305 | 362 | 658 | 923 | 105 | 105 | 103 | 109 | 838 | 509 | 545 | -7,888 |
| 2010 | -8,167 | -8,322 | -8,319 | -7,990 | -8,143 | -8,145 | -8,145 | -8,147 | -8,189 | -8,183 | -8,165 | 345 |
| 2011 | 911 | 484 | 118 | -258 | 439 | 447 | 453 | 460 | 466 | 435 | 442 | 813 |
| 2012 | 439 | 562 | 1,091 | 1,203 | 656 | 652 | 654 | 1,048 | 737 | 752 | 717 | 399 |
| 2013 | 540 | -263 | -1,375 | -604 | -98 | 428 | 757 | 605 | 457 | 450 | 392 | 329 |
| 2014 | 396 | 1,507 | 2,485 | 1,625 | 1,134 | 589 | 253 | 782 | 798 | 870 | 1,009 | 1,144 |
| 2015 | 1,208 | -16 | 963 | 942 | 925 | 938 | 934 | 153 | 475 | 429 | 321 | 423 |
| 2016 | 137 | 1,572 | 458 | 446 | 447 | 447 | 441 | 433 | 138 | 275 | 273 | -61 |
| 2017 | 209 | 63 | 84 | 96 | 104 | 105 | 112 | 121 | 258 | 70 | 70 | -4,242 |
| 2018 | -4,051 | -3,925 | -3,908 | -4,214 | -3,877 | -3,887 | -3,895 | -3,905 | -4,068 | -3,939 | -4,010 | 800 |
| 2019 | -540 | -684 | -176 | 346 | 166 | 184 | 200 | 218 | -34 | -57 | -95 | -287 |
| 2020 | 746 | 736 | 354 | -714 | -830 | -668 | -630 | -570 | -534 | -1,206 | -509 | -314 |
| 2021 | -44 | -977 | -672 | 73 | 28 | -140 | 616 | 751 | 708 | 1,057 | 761 | 425 |
| 2022 | -634 | 58 | -459 | 109 | 342 | 336 | -450 | -669 | -665 | -660 | -553 | -636 |
| 2023 | 348 | 578 | 731 | 281 | 51 | 61 | 52 | 83 | 321 | 811 | 447 | 635 |
| 2024 | -87 | |||||||||||
| - = No Data Reported; -- = Not Applicable; NA = Not Available; W = Withheld to avoid disclosure of individual company data. |
| Release Date: 3/29/2024 |
| Next Release Date: 4/30/2024 |