|
Download Data (XLS File) |
|
|||||
|
|||||
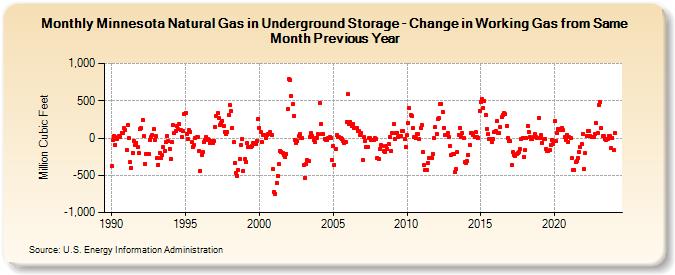
| Minnesota Natural Gas in Underground Storage - Change in Working Gas from Same Month Previous Year (Million Cubic Feet) | |||||
| Year | Jan | Feb | Mar | Apr | May | Jun | Jul | Aug | Sep | Oct | Nov | Dec |
|---|---|---|---|---|---|---|---|---|---|---|---|---|
| 1990 | -381 | -30 | 28 | -87 | -12 | 8 | 23 | 18 | 74 | 67 | 131 | 109 |
| 1991 | -157 | 171 | -4 | -326 | -398 | -197 | -39 | -95 | -63 | -124 | -204 | 127 |
| 1992 | 134 | 244 | 21 | -342 | -210 | -216 | -209 | -21 | 12 | 42 | 116 | -30 |
| 1993 | 23 | -266 | -356 | -196 | -268 | -230 | -119 | -170 | -58 | 29 | -39 | -147 |
| 1994 | -278 | -55 | 173 | 65 | 96 | 156 | 117 | 190 | 101 | 16 | 88 | 327 |
| 1995 | 341 | 59 | -7 | 102 | 84 | -58 | -121 | -92 | 0 | 8 | 9 | -174 |
| 1996 | -442 | -226 | -190 | -55 | -20 | 12 | -7 | -28 | -67 | -40 | -68 | -40 |
| 1997 | 153 | 297 | 330 | 273 | 179 | 197 | 232 | 159 | 86 | 53 | 80 | 303 |
| 1998 | 446 | 360 | 132 | -58 | -330 | -473 | -505 | -429 | -284 | -97 | -8 | -442 |
| 1999 | -285 | -320 | -72 | -126 | -127 | -124 | -105 | -68 | -71 | -83 | -39 | 253 |
| 2000 | 139 | 79 | -54 | 44 | 42 | 1 | 35 | 57 | 52 | 76 | 39 | -418 |
| 2001 | -723 | -748 | -602 | -509 | -355 | -168 | -182 | -196 | -230 | -255 | -213 | 388 |
| 2002 | 791 | 782 | 561 | 450 | 299 | -20 | -72 | -42 | 25 | 49 | 0 | -3 |
| 2003 | -358 | -530 | -355 | -301 | -302 | 7 | 61 | 32 | -28 | -49 | 2 | 4 |
| 2004 | 50 | 469 | 184 | 50 | 51 | -13 | -23 | -31 | 0 | 8 | 1 | -294 |
| 2005 | -104 | -358 | -152 | 45 | 8 | 7 | -3 | -10 | -38 | -65 | -50 | 216 |
| 2006 | 586 | 186 | 219 | 156 | 192 | 139 | 139 | 138 | 96 | 97 | 35 | 62 |
| 2007 | -298 | 10 | -39 | -123 | -114 | -5 | -6 | -29 | -27 | -22 | -5 | -14 |
| 2008 | -268 | -282 | -145 | -99 | -108 | -171 | -193 | -111 | -147 | -77 | 15 | -169 |
| 2009 | 67 | 182 | -9 | 72 | 72 | 8 | 24 | 32 | 95 | 92 | -10 | -118 |
| 2010 | 34 | 206 | 399 | 303 | 297 | 129 | 9 | -5 | 56 | 53 | -17 | 135 |
| 2011 | 172 | -188 | -360 | -427 | -427 | -331 | -271 | -266 | -265 | -210 | 0 | 144 |
| 2012 | 55 | 259 | 263 | 458 | 458 | 351 | 136 | 45 | 40 | 63 | 14 | -105 |
| 2013 | -227 | -220 | -220 | -456 | -422 | -190 | 44 | 137 | 12 | 65 | -3 | -328 |
| 2014 | -336 | -313 | -231 | -92 | 63 | 63 | 47 | 14 | 75 | 11 | 6 | 364 |
| 2015 | 489 | 517 | 406 | 503 | 313 | 125 | 54 | -13 | -18 | -50 | -8 | 78 |
| 2016 | 100 | 228 | 63 | 63 | 145 | 283 | 311 | 337 | 316 | 158 | -4 | -38 |
| 2017 | -44 | -368 | -194 | -223 | -237 | -221 | -205 | -190 | -145 | -17 | 6 | -248 |
| 2018 | -165 | -5 | 162 | 85 | 17 | -11 | -10 | 15 | 52 | 17 | -3 | 274 |
| 2019 | -1 | 40 | -61 | -8 | -9 | -147 | -177 | -172 | -163 | -89 | -27 | -75 |
| 2020 | 222 | -40 | 73 | 118 | 118 | 112 | 141 | 103 | 18 | -23 | 43 | -51 |
| 2021 | 10 | -3 | -270 | -425 | -425 | -323 | -307 | -264 | -187 | -123 | -81 | 55 |
| 2022 | -413 | -205 | 22 | 93 | 93 | 26 | 12 | 9 | 8 | 51 | 197 | 68 |
| 2023 | 447 | 477 | 133 | 23 | 23 | -12 | -25 | -15 | 31 | 33 | -135 | 4 |
| 2024 | -160 | |||||||||||
| - = No Data Reported; -- = Not Applicable; NA = Not Available; W = Withheld to avoid disclosure of individual company data. |
| Release Date: 3/29/2024 |
| Next Release Date: 4/30/2024 |