|
Download Data (XLS File) |
|
|||||
|
|||||
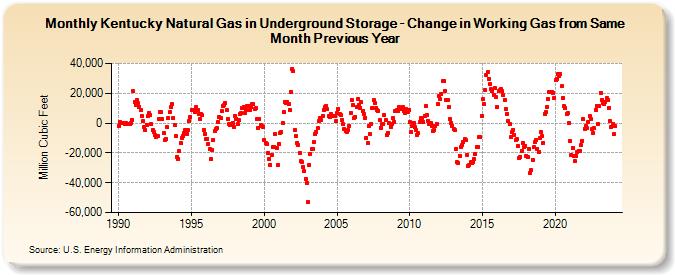
| Kentucky Natural Gas in Underground Storage - Change in Working Gas from Same Month Previous Year (Million Cubic Feet) | |||||
| Year | Jan | Feb | Mar | Apr | May | Jun | Jul | Aug | Sep | Oct | Nov | Dec |
|---|---|---|---|---|---|---|---|---|---|---|---|---|
| 1990 | -1,772 | 682 | 336 | 86 | 308 | -489 | 138 | -272 | -702 | -351 | 130 | 2,383 |
| 1991 | 21,249 | 14,278 | 11,919 | 15,552 | 13,179 | 11,123 | 8,684 | 4,865 | 1,110 | -2,624 | -4,707 | -1,444 |
| 1992 | 4,569 | 6,818 | 5,559 | -712 | -4,310 | -6,053 | -7,850 | -9,429 | -8,687 | 2,440 | 7,441 | 7,127 |
| 1993 | 2,921 | -6,726 | -11,466 | -10,508 | -2,894 | 3,383 | 7,382 | 10,574 | 12,748 | 3,133 | -1,188 | -8,886 |
| 1994 | -22,456 | -23,840 | -18,753 | -13,261 | -9,993 | -8,478 | -6,371 | -4,311 | -7,081 | -4,811 | 1,357 | 3,777 |
| 1995 | 9,092 | 8,783 | 8,796 | 7,495 | 10,507 | 8,782 | 5,943 | 2,928 | 6,049 | 5,218 | -4,407 | -7,550 |
| 1996 | -10,688 | -10,322 | -13,783 | -17,689 | -24,225 | -17,725 | -11,393 | -5,359 | -3,672 | -3,574 | 789 | 4,234 |
| 1997 | 3,690 | 7,898 | 11,654 | 12,129 | 13,638 | 8,487 | 2,760 | -599 | -1,016 | -714 | 193 | -2,593 |
| 1998 | 5,008 | 3,069 | -525 | 1,905 | 6,058 | 6,489 | 9,967 | 10,911 | 6,770 | 9,055 | 11,307 | 11,756 |
| 1999 | 8,921 | 11,056 | 12,812 | 12,646 | 9,182 | 9,905 | 2,777 | -3,447 | 2,763 | -1,328 | -1,890 | -2,385 |
| 2000 | -11,306 | -13,462 | -14,143 | -19,906 | -24,169 | -28,134 | -21,280 | -16,246 | -15,897 | -7,383 | -16,857 | -28,131 |
| 2001 | -13,740 | -6,332 | -6,295 | 323 | 7,420 | 14,388 | 13,707 | 13,848 | 12,665 | 8,917 | 20,723 | 36,612 |
| 2002 | 34,655 | -4,775 | -8,726 | -13,271 | -14,665 | -19,883 | -25,591 | -26,396 | -29,155 | -32,427 | -37,275 | -40,245 |
| 2003 | -53,108 | -28,188 | -20,712 | -17,634 | -17,477 | -12,365 | -7,334 | -5,948 | -3,566 | 1,721 | 3,241 | 2,196 |
| 2004 | 4,777 | 8,953 | 10,909 | 11,661 | 9,211 | 4,566 | 4,425 | 6,087 | 4,628 | 4,497 | 4,815 | 1,362 |
| 2005 | 6,636 | 9,553 | 5,841 | 5,369 | 2,264 | -857 | -3,906 | -5,534 | -6,106 | -4,453 | -1,707 | 6,751 |
| 2006 | 15,760 | 12,369 | 3,351 | 4,358 | 10,551 | 16,120 | 12,396 | 10,447 | 13,990 | 8,039 | 6,335 | 3,654 |
| 2007 | -9,715 | -13,592 | -1,986 | -7,450 | -690 | 10,170 | 15,334 | 13,496 | 9,955 | 9,054 | 8,437 | 1,974 |
| 2008 | -3,268 | -900 | -507 | 5,340 | 1,868 | -8,025 | -6,452 | -203 | -2,370 | -637 | 3,331 | 1,055 |
| 2009 | 8,061 | 8,502 | 7,961 | 10,842 | 10,389 | 9,147 | 10,524 | 7,804 | 6,778 | 9,373 | 7,170 | 8,643 |
| 2010 | 1,069 | -5,737 | -2,156 | 356 | -2,619 | -4,644 | -7,789 | -6,923 | 487 | 3,251 | 3,707 | 869 |
| 2011 | 4,862 | 11,368 | 5,283 | 1,593 | -872 | -56 | -2,004 | -5,165 | -4,514 | -1,912 | -546 | 12,732 |
| 2012 | 17,922 | 16,075 | 19,618 | 28,206 | 28,240 | 21,552 | 15,715 | 15,639 | 10,765 | 2,751 | 115 | -1,944 |
| 2013 | -4,227 | -4,770 | -17,261 | -26,238 | -26,922 | -21,826 | -15,927 | -14,959 | -12,801 | -10,992 | -11,630 | -21,139 |
| 2014 | -28,515 | -28,035 | -26,301 | -26,524 | -26,310 | -24,336 | -20,561 | -15,986 | -15,691 | -9,254 | -9,527 | 5,047 |
| 2015 | 15,979 | 12,486 | 22,150 | 32,457 | 34,038 | 29,834 | 26,351 | 22,700 | 21,477 | 19,192 | 23,473 | 17,237 |
| 2016 | 11,014 | 21,500 | 21,915 | 22,918 | 21,339 | 18,578 | 15,555 | 9,403 | 6,165 | 1,247 | -534 | -9,336 |
| 2017 | -6,096 | -4,311 | -7,933 | -11,367 | -10,856 | -15,325 | -23,644 | -22,469 | -18,613 | -13,125 | -16,244 | -15,108 |
| 2018 | -21,946 | -22,615 | -17,154 | -33,492 | -31,703 | -24,496 | -16,038 | -12,861 | -11,641 | -17,333 | -19,413 | -10,127 |
| 2019 | -5,799 | -8,562 | -13,035 | 6,273 | 7,581 | 11,093 | 16,500 | 20,996 | 20,572 | 21,045 | 20,528 | 16,920 |
| 2020 | 28,869 | 29,449 | 32,965 | 31,554 | 32,879 | 24,573 | 17,126 | 11,322 | 10,014 | 6,011 | 6,589 | 154 |
| 2021 | -12,071 | -21,231 | -16,610 | -21,966 | -25,642 | -21,730 | -19,291 | -18,461 | -18,553 | -14,826 | -11,837 | 2,736 |
| 2022 | -3,664 | -1,772 | -3,480 | 658 | 4,505 | 2,645 | -3,877 | -6,488 | -3,334 | 9,058 | 11,671 | -509 |
| 2023 | 11,272 | 20,206 | 15,460 | 13,456 | 13,004 | 14,292 | 16,658 | 15,649 | 10,406 | 1,155 | -2,365 | -264 |
| 2024 | -7,521 | |||||||||||
| - = No Data Reported; -- = Not Applicable; NA = Not Available; W = Withheld to avoid disclosure of individual company data. |
| Release Date: 3/29/2024 |
| Next Release Date: 4/30/2024 |