|
Download Data (XLS File) |
|
|||||
|
|||||
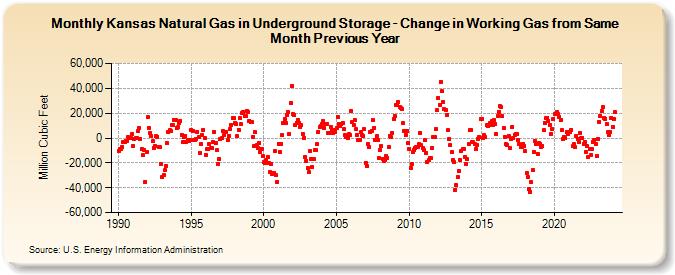
| Kansas Natural Gas in Underground Storage - Change in Working Gas from Same Month Previous Year (Million Cubic Feet) | |||||
| Year | Jan | Feb | Mar | Apr | May | Jun | Jul | Aug | Sep | Oct | Nov | Dec |
|---|---|---|---|---|---|---|---|---|---|---|---|---|
| 1990 | -10,362 | -8,989 | -8,480 | -6,853 | -3,138 | -3,221 | -2,686 | -2,091 | 824 | 166 | -307 | 3,561 |
| 1991 | -6,300 | -645 | -100 | -132 | 5,625 | 8,255 | -439 | -9,003 | -13,999 | -9,506 | -35,041 | -11,017 |
| 1992 | 16,928 | 8,288 | 4,215 | 1,589 | -2,700 | -7,788 | -6,391 | 1,723 | 1,181 | -7,206 | -7,569 | -20,817 |
| 1993 | -31,418 | -30,129 | -26,038 | -22,202 | -4,247 | 4,828 | 6,211 | 5,963 | 10,199 | 10,284 | 14,158 | 14,727 |
| 1994 | 8,105 | 8,620 | 12,116 | 13,982 | 2,713 | -3,469 | 465 | 1,613 | -3,134 | -1,516 | -2,683 | -1,820 |
| 1995 | 6,294 | 5,619 | -1,798 | -1,708 | -758 | 5,090 | 429 | -12,148 | -5,167 | 2,571 | 6,337 | -382 |
| 1996 | -13,493 | -9,073 | -8,909 | -5,139 | -8,059 | -8,320 | -3,096 | 5,032 | -3,652 | -10,041 | -20,788 | -17,043 |
| 1997 | -428 | -376 | 5,547 | 2,157 | 4,926 | 4,921 | -1,501 | 1,826 | 7,478 | 10,419 | 16,315 | 16,042 |
| 1998 | 11,813 | 11,577 | 1,400 | 6,483 | 15,937 | 10,954 | 20,399 | 21,308 | 17,798 | 17,624 | 21,846 | 20,624 |
| 1999 | 13,984 | 12,552 | 12,575 | 1,169 | -6,534 | 4,452 | -5,711 | -8,214 | -3,713 | -11,353 | -8,496 | -14,608 |
| 2000 | -19,496 | -19,864 | -17,953 | -15,393 | -20,197 | -27,389 | -20,641 | -28,847 | -27,883 | -10,081 | -30,076 | -35,181 |
| 2001 | -4,626 | -11,052 | -4,872 | 2,608 | 11,857 | 15,503 | 12,332 | 18,481 | 20,601 | 3,077 | 28,178 | 41,682 |
| 2002 | 19,081 | 18,214 | 10,730 | 12,319 | 14,722 | 12,406 | 8,772 | 10,192 | 3,627 | 145 | -15,424 | -18,271 |
| 2003 | -24,329 | -27,523 | -10,527 | -16,634 | -23,441 | -16,893 | -10,014 | -9,271 | -4,876 | 5,125 | 8,903 | 9,916 |
| 2004 | 11,472 | 13,648 | 7,994 | 11,334 | 11,436 | 4,026 | 4,027 | 9,180 | 6,749 | 4,045 | 6,727 | 5,238 |
| 2005 | 7,990 | 17,093 | 11,543 | 9,449 | 11,202 | 12,138 | 6,976 | 2,036 | 552 | -33 | 3,175 | 2,556 |
| 2006 | 21,836 | 12,811 | 10,359 | 14,717 | 6,898 | 2,384 | -1,416 | -1,242 | 4,569 | 2,468 | 1,664 | 6,904 |
| 2007 | -19,871 | -22,577 | -4,685 | -6,833 | 4,566 | 5,906 | 14,474 | 8,272 | -1,223 | 1,232 | -1,319 | -15,804 |
| 2008 | -9,983 | -6,581 | -16,764 | -18,129 | -17,587 | -14,321 | -15,783 | -7,113 | 1,807 | 536 | 4,405 | 14,938 |
| 2009 | 17,855 | 26,613 | 26,229 | 29,024 | 25,173 | 24,413 | 23,593 | 11,763 | 5,263 | 2,418 | 5,494 | -4,077 |
| 2010 | -8,510 | -24,139 | -20,763 | -11,346 | -9,983 | -8,284 | -7,174 | -7,210 | -5,182 | 4,334 | -5,984 | -7,876 |
| 2011 | -9,861 | -1,655 | -11,982 | -19,165 | -17,554 | -15,892 | -16,114 | -7,749 | 711 | 654 | 7,135 | 22,277 |
| 2012 | 32,294 | 26,670 | 45,387 | 37,861 | 29,188 | 23,118 | 22,795 | 18,352 | 6,187 | -864 | -5,480 | -11,620 |
| 2013 | -17,512 | -19,547 | -41,439 | -38,081 | -31,497 | -26,408 | -17,344 | -10,303 | -9,217 | -8,580 | -15,094 | -21,237 |
| 2014 | -17,232 | -4,952 | 6,104 | 6,501 | -2,855 | -3,442 | -4,866 | -8,875 | -5,941 | -520 | 663 | 15,668 |
| 2015 | 15,586 | 239 | 2,126 | 910 | 10,394 | 9,472 | 10,849 | 12,201 | 13,639 | 10,295 | 14,194 | 11,455 |
| 2016 | 3,373 | 17,845 | 21,158 | 25,547 | 24,672 | 17,504 | 8,128 | 976 | -4,911 | -5,246 | 1,714 | -8,376 |
| 2017 | -642 | 9,035 | -282 | 2,800 | 3,471 | 3,428 | -1,868 | -4,622 | -7,357 | -6,949 | -5,201 | -6,205 |
| 2018 | -10,707 | -28,111 | -31,477 | -40,761 | -43,140 | -35,493 | -25,431 | -11,100 | -2,442 | -4,738 | -12,523 | -4,263 |
| 2019 | -4,980 | -7,300 | -6,312 | 6,062 | 12,341 | 15,846 | 16,120 | 14,068 | 10,581 | 3,327 | 7,429 | 15,221 |
| 2020 | 19,313 | 19,476 | 21,154 | 19,511 | 17,247 | 14,398 | 6,228 | -1,186 | 1,114 | -84 | 4,965 | 3,344 |
| 2021 | 4,612 | 5,210 | 6,565 | -6,813 | -4,841 | -7,577 | 1,543 | -417 | -3,175 | 4,358 | -384 | 385 |
| 2022 | -4,672 | -3,061 | -10,931 | -6,400 | -14,949 | -8,866 | -13,810 | -9,177 | -2,895 | -1,267 | -4,726 | -14,313 |
| 2023 | -549 | 13,160 | 17,912 | 21,914 | 24,659 | 16,393 | 15,573 | 11,046 | 4,448 | 2,339 | 4,552 | 16,341 |
| 2024 | 9,030 | 15,149 | 20,565 | 14,784 | 8,039 | 5,752 | ||||||
| - = No Data Reported; -- = Not Applicable; NA = Not Available; W = Withheld to avoid disclosure of individual company data. |
| Release Date: 8/30/2024 |
| Next Release Date: 9/30/2024 |