|
Download Data (XLS File) |
|
|||||
|
|||||
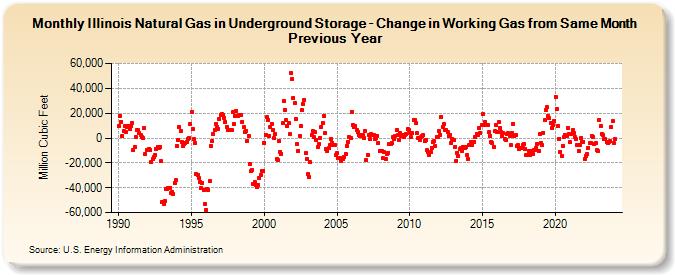
| Illinois Natural Gas in Underground Storage - Change in Working Gas from Same Month Previous Year (Million Cubic Feet) | |||||
| Year | Jan | Feb | Mar | Apr | May | Jun | Jul | Aug | Sep | Oct | Nov | Dec |
|---|---|---|---|---|---|---|---|---|---|---|---|---|
| 1990 | 9,275 | 18,043 | 13,193 | 1,851 | 5,255 | 9,637 | 5,108 | 8,495 | 9,773 | 7,534 | 9,475 | 11,984 |
| 1991 | -9,933 | -7,259 | 454 | 6,145 | 6,270 | 3,648 | 2,744 | 1,010 | -13 | 7,942 | -12,681 | -9,742 |
| 1992 | -9,345 | -8,466 | -9,599 | -19,126 | -16,878 | -15,372 | -13,507 | -9,010 | -7,228 | -7,653 | -6,931 | -18,707 |
| 1993 | -51,572 | -52,876 | -51,081 | -40,760 | -41,229 | -40,132 | -39,867 | -44,533 | -43,110 | -44,873 | -36,080 | -34,184 |
| 1994 | -6,101 | -1,289 | 8,929 | 5,795 | -3,558 | -6,807 | -4,948 | -4,181 | -3,006 | -678 | -77 | 11,376 |
| 1995 | 20,962 | 7,104 | -805 | -3,970 | -29,257 | -30,038 | -32,571 | -35,022 | -40,472 | -36,406 | -41,858 | -53,433 |
| 1996 | -57,642 | -40,939 | -41,504 | -34,834 | -6,148 | -2,598 | 3,084 | 6,435 | 11,435 | 9,244 | 7,513 | 15,549 |
| 1997 | 18,479 | 19,537 | 18,859 | 16,125 | 12,752 | 8,775 | 6,069 | 6,829 | 6,578 | 6,212 | 20,677 | 11,251 |
| 1998 | 17,934 | 22,067 | 17,623 | 18,194 | 18,602 | 18,706 | 13,154 | 8,527 | 5,210 | 5,912 | -2,080 | 1,650 |
| 1999 | -21,059 | -26,756 | -25,355 | -37,082 | -35,407 | -37,999 | -39,188 | -37,494 | -32,413 | -29,859 | -26,477 | -26,720 |
| 2000 | -3,683 | 2,681 | 16,664 | 14,611 | 1,962 | 9,111 | 11,490 | 6,616 | -205 | 2,858 | -16,931 | -17,840 |
| 2001 | -2,606 | -11,125 | -12,599 | 11,789 | 29,941 | 22,809 | 14,426 | 9,711 | 11,736 | 2,955 | 52,403 | 47,533 |
| 2002 | 32,524 | 28,108 | 15,368 | -4,648 | -10,103 | 1,438 | 9,549 | 22,225 | 27,226 | 30,904 | -12,080 | -16,539 |
| 2003 | -29,331 | -31,705 | -19,673 | 2,552 | 5,573 | 704 | 4,594 | -1,497 | -6,942 | -4,443 | 384 | 9,140 |
| 2004 | 12,237 | 17,798 | 4,079 | -8,590 | -10,096 | -8,252 | -5,800 | -581 | -3,923 | -5,602 | -5,483 | -13,875 |
| 2005 | -12,409 | -15,891 | -15,692 | -18,226 | -16,923 | -16,874 | -15,566 | -12,636 | -6,217 | -2,977 | 554 | -206 |
| 2006 | 21,068 | 10,640 | 8,752 | 9,365 | 6,660 | 4,759 | 2,465 | 1,616 | 2,447 | 2,417 | -2 | 5,817 |
| 2007 | -17,777 | -13,311 | 2,587 | -997 | 3,100 | 2,170 | 2,275 | -456 | 345 | 1,729 | -4,173 | -10,327 |
| 2008 | -10,119 | -10,314 | -16,298 | -11,648 | -16,497 | -12,560 | -11,731 | -4,832 | -4,967 | -4,248 | 696 | -1,148 |
| 2009 | 1,970 | 6,584 | 2,077 | -1,266 | 3,721 | 1,353 | 2,270 | 1,059 | 2,491 | 3,090 | 7,079 | 6,672 |
| 2010 | 3,657 | 432 | 4,218 | 14,903 | 14,202 | 12,107 | 3,800 | 356 | -1,949 | 439 | 1,249 | 2,321 |
| 2011 | -2,159 | -1,603 | -9,865 | -11,348 | -13,948 | -11,634 | -7,654 | -3,290 | -2,654 | -6,358 | 949 | 1,175 |
| 2012 | 5,715 | 2,772 | 16,963 | 9,218 | 10,993 | 6,246 | 6,133 | 4,934 | 1,813 | 2,511 | -4,163 | -766 |
| 2013 | -1,752 | -7,147 | -18,160 | -11,767 | -14,327 | -8,820 | -7,918 | -10,359 | -6,916 | -8,303 | -7,397 | -13,824 |
| 2014 | -17,017 | -5,927 | -3,160 | -5,833 | -3,505 | -2,863 | 432 | 3,261 | 2,820 | 7,711 | 4,416 | 10,276 |
| 2015 | 18,941 | 10,557 | 13,020 | 10,570 | 10,632 | 4,638 | 1,906 | -2,908 | -4,131 | -6,939 | 5,451 | 10,834 |
| 2016 | 4,759 | 12,589 | 8,399 | 4,856 | 1,676 | 3,856 | -389 | -1,275 | 2,851 | 3,778 | 1,942 | -5,994 |
| 2017 | 4,221 | 11,578 | 1,691 | 2,092 | -6,450 | -5,845 | -9,105 | -8,085 | -8,143 | -5,661 | -4,604 | -8,655 |
| 2018 | -13,964 | -14,053 | -10,138 | -13,311 | -10,151 | -12,929 | -9,374 | -9,256 | -7,842 | -4,747 | -10,222 | 3,130 |
| 2019 | -3,920 | -5,907 | 4,241 | 14,293 | 22,590 | 24,638 | 17,701 | 16,041 | 11,936 | 7,827 | 10,431 | 14,079 |
| 2020 | 33,312 | 23,008 | 9,530 | -438 | -10,982 | -14,262 | -6,611 | 728 | 2,557 | 1,541 | 7,940 | 3,376 |
| 2021 | -3,539 | 3,167 | 6,411 | 4,135 | 966 | -1,038 | -5,235 | -10,631 | -5,910 | 224 | -2,891 | -2,962 |
| 2022 | -16,893 | -14,377 | -12,738 | -7,813 | -4,308 | -3,769 | 1,461 | 1,130 | -5,149 | -4,243 | -9,966 | -10,719 |
| 2023 | 14,719 | 9,536 | 3,430 | 2,231 | -1,180 | -1,062 | -3,416 | -4,286 | -3,390 | -2,677 | 9,066 | 13,584 |
| 2024 | -4,090 | |||||||||||
| - = No Data Reported; -- = Not Applicable; NA = Not Available; W = Withheld to avoid disclosure of individual company data. |
| Release Date: 3/29/2024 |
| Next Release Date: 4/30/2024 |