|
Download Data (XLS File) |
|
|||||
|
|||||
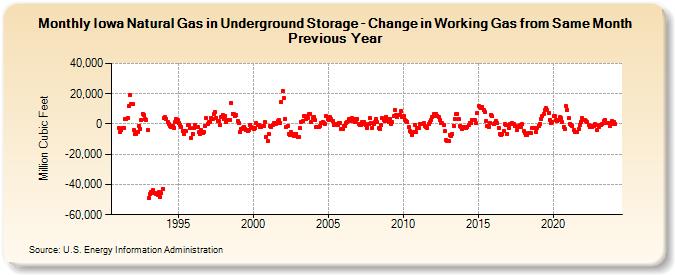
| Iowa Natural Gas in Underground Storage - Change in Working Gas from Same Month Previous Year (Million Cubic Feet) | |||||
| Year | Jan | Feb | Mar | Apr | May | Jun | Jul | Aug | Sep | Oct | Nov | Dec |
|---|---|---|---|---|---|---|---|---|---|---|---|---|
| 1991 | -2,696 | -5,556 | -4,018 | -2,430 | -2,408 | 3,493 | 3,414 | 4,058 | 11,806 | 19,414 | 13,253 | 13,393 |
| 1992 | -4,224 | -6,407 | -6,304 | -5,070 | -1,061 | -3,484 | 2,536 | 6,836 | 6,037 | 3,618 | 2,568 | -3,773 |
| 1993 | -49,040 | -46,415 | -45,078 | -43,755 | -45,456 | -45,569 | -46,271 | -46,798 | -44,848 | -48,360 | -45,854 | -42,967 |
| 1994 | 3,868 | 4,407 | 3,612 | 1,225 | -15 | -1,608 | -2,255 | -1,606 | -2,529 | 977 | 3,064 | 2,918 |
| 1995 | 662 | -725 | -2,062 | -4,549 | -6,346 | -4,768 | -4,875 | -978 | -985 | -2,955 | -9,054 | -6,318 |
| 1996 | -2,596 | -433 | -1,982 | -2,204 | -5,609 | -6,677 | -4,290 | -5,912 | -4,983 | -1,206 | 3,642 | 151 |
| 1997 | 1,022 | 1,266 | 4,194 | 3,372 | 6,482 | 7,826 | 4,075 | 1,746 | 1,892 | -654 | 4,614 | 6,207 |
| 1998 | 3,213 | 5,242 | 1,504 | 2,782 | 2,910 | 2,954 | 13,883 | 6,881 | 6,269 | 5,020 | 5,642 | 2,027 |
| 1999 | 370 | -5,005 | -3,089 | -2,827 | -1,829 | -3,398 | -4,159 | -4,961 | -4,002 | -570 | -1,736 | -2,474 |
| 2000 | -3,047 | -2,618 | 952 | -682 | -881 | -1,862 | -1,713 | -1,359 | -1,632 | 1,319 | -8,330 | -11,582 |
| 2001 | -6,928 | -1,232 | -1,767 | -655 | 477 | 778 | 8 | 1,843 | 2,717 | 914 | 14,779 | 22,106 |
| 2002 | 16,981 | 3,620 | -1,760 | -1,514 | -6,345 | -7,521 | -5,474 | -6,502 | -7,648 | -6,402 | -6,323 | -8,306 |
| 2003 | -8,483 | -2,892 | 1,534 | 1,977 | 4,970 | 5,092 | 3,615 | 4,021 | 6,308 | 6,598 | 1,215 | 3,956 |
| 2004 | 4,699 | 2,871 | -1,856 | -2,205 | -1,719 | -1,411 | 476 | 1,577 | 712 | -97 | 5,057 | 3,228 |
| 2005 | 2,882 | 4,438 | 3,219 | 1,839 | -501 | -173 | -282 | -704 | 533 | 940 | -3,038 | -3,438 |
| 2006 | -1,293 | -1,304 | 762 | 1,347 | 3,069 | 3,266 | 2,153 | 3,626 | 3,245 | 1,394 | 2,452 | 3,510 |
| 2007 | 112 | -773 | -844 | 1,016 | 1,531 | 297 | -859 | -2,375 | -286 | 3,679 | 516 | -2,451 |
| 2008 | 200 | 1,154 | 3,408 | 1,089 | -2,539 | -3,096 | -515 | 3,663 | 2,698 | 2,241 | 4,888 | 3,474 |
| 2009 | 993 | 3,232 | 178 | 1,266 | 5,031 | 9,364 | 5,707 | 4,813 | 5,692 | 6,008 | 8,285 | 4,861 |
| 2010 | 5,220 | 2,433 | 2,061 | 1,364 | -2,017 | -4,942 | -5,547 | -7,401 | -5,455 | -772 | -5,516 | -2,588 |
| 2011 | -2,594 | -294 | 190 | -92 | 433 | -1,254 | -1,883 | -2,354 | 162 | 1,228 | 2,642 | 4,544 |
| 2012 | 6,721 | 5,204 | 6,542 | 5,493 | 4,775 | 2,418 | 557 | 325 | -723 | -4,918 | -10,758 | -11,317 |
| 2013 | -11,149 | -7,404 | -7,650 | -6,614 | -1,173 | 3,389 | 6,425 | 6,747 | 3,169 | -1,354 | -1,884 | -3,074 |
| 2014 | -2,239 | -2,982 | -2,651 | -2,322 | -955 | 955 | 607 | 2,865 | 2,773 | 2,512 | 410 | 7,424 |
| 2015 | 11,829 | 11,132 | 10,661 | 11,217 | 9,124 | 8,105 | 1,930 | -1,282 | -1,735 | 824 | 6,178 | 4,955 |
| 2016 | 78 | 534 | 2,156 | 548 | -2,458 | -6,563 | -7,201 | -6,737 | -4,832 | -241 | -753 | -6,414 |
| 2017 | -2,558 | 64 | -339 | 522 | -248 | -1,187 | -1,417 | -3,690 | -2,284 | -917 | -2,007 | -329 |
| 2018 | -4,690 | -6,183 | -7,100 | -7,198 | -5,949 | -6,273 | -6,296 | -2,563 | -2,505 | -2,608 | -5,228 | -2,859 |
| 2019 | -1,038 | 57 | 3,474 | 5,193 | 6,792 | 9,131 | 10,281 | 9,059 | 7,559 | 2,707 | 627 | 1,067 |
| 2020 | 5,112 | 5,106 | 2,470 | 1,904 | 2,835 | 4,548 | 3,650 | 1,253 | -1,817 | -3,523 | 11,573 | 9,470 |
| 2021 | 3,774 | 223 | -566 | -1,467 | -4,010 | -5,178 | -5,016 | -5,039 | -3,492 | -459 | 1,187 | 3,886 |
| 2022 | 2,728 | 2,401 | 1,934 | 1,157 | -880 | -2,248 | -1,283 | -1,994 | -1,242 | -55 | -698 | -3,696 |
| 2023 | -2,084 | -558 | -793 | 180 | 1,763 | 2,665 | 456 | 898 | 654 | -1,359 | -221 | 1,961 |
| 2024 | 1,480 | |||||||||||
| - = No Data Reported; -- = Not Applicable; NA = Not Available; W = Withheld to avoid disclosure of individual company data. |
| Release Date: 3/29/2024 |
| Next Release Date: 4/30/2024 |