|
Download Data (XLS File) |
|
|||||
|
|||||
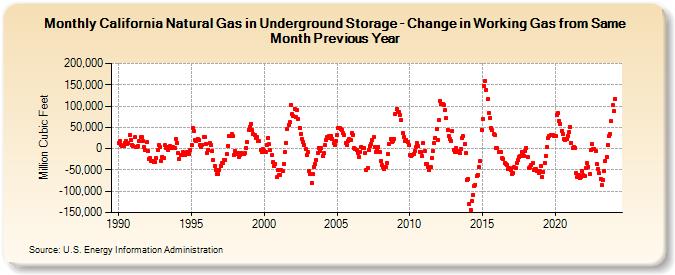
| California Natural Gas in Underground Storage - Change in Working Gas from Same Month Previous Year (Million Cubic Feet) | |||||
| Year | Jan | Feb | Mar | Apr | May | Jun | Jul | Aug | Sep | Oct | Nov | Dec |
|---|---|---|---|---|---|---|---|---|---|---|---|---|
| 1990 | 13,690 | 18,121 | 8,849 | 5,853 | 7,132 | 14,219 | 18,130 | 10,561 | 13,390 | 31,974 | 19,181 | 9,703 |
| 1991 | 6,425 | 26,360 | 4,734 | 4,680 | 6,001 | 17,198 | 26,493 | 26,589 | 17,703 | 3,011 | -3,286 | 14,947 |
| 1992 | -6,546 | -23,935 | -22,706 | -29,553 | -29,442 | -31,729 | -31,331 | -21,662 | -2,945 | 7,561 | 4,600 | -28,127 |
| 1993 | -18,888 | -21,388 | 7,592 | 2,646 | 4,145 | -4,114 | 5,805 | 2,657 | 2,580 | 3,170 | 1,004 | 23,856 |
| 1994 | 14,332 | -10,557 | -24,707 | -14,896 | -15,082 | -8,607 | -14,837 | -14,903 | -8,310 | -6,861 | -11,874 | -3,316 |
| 1995 | 9,020 | 48,536 | 41,487 | 19,773 | 18,032 | 23,794 | 20,147 | 9,074 | 3,393 | 9,305 | 28,072 | 27,725 |
| 1996 | 11,397 | -9,234 | -2,584 | 12,300 | 9,656 | -6,460 | -27,293 | -40,711 | -48,939 | -60,551 | -59,540 | -49,099 |
| 1997 | -40,230 | -34,692 | -32,959 | -25,826 | -25,504 | -12,207 | 6,032 | 29,600 | 29,445 | 34,743 | 28,959 | -13,950 |
| 1998 | -5,371 | -12,686 | -10,869 | -19,380 | -14,193 | -9,839 | -11,762 | -12,911 | -9,647 | 2,464 | 15,247 | 43,982 |
| 1999 | 50,078 | 58,670 | 42,929 | 34,802 | 32,625 | 25,819 | 27,541 | 17,343 | 17,032 | -2,080 | -7,409 | -868 |
| 2000 | -4,433 | -7,829 | 8,806 | 26,111 | 10,022 | -3,928 | -15,609 | -32,041 | -40,549 | -35,159 | -67,148 | -50,727 |
| 2001 | -62,456 | -60,805 | -49,126 | -51,647 | -35,157 | -7,482 | 14,034 | 45,925 | 56,611 | 61,879 | 103,253 | 81,604 |
| 2002 | 77,360 | 92,996 | 73,360 | 91,044 | 70,735 | 49,202 | 35,581 | 23,077 | 16,180 | 9,161 | -1,840 | -15,246 |
| 2003 | -7,267 | -51,993 | -59,082 | -80,499 | -59,562 | -41,998 | -36,216 | -26,184 | -9,758 | 2,419 | -5,035 | 1,117 |
| 2004 | -17,608 | -11,041 | 8,202 | 21,003 | 28,389 | 28,924 | 25,422 | 30,023 | 23,863 | 12,455 | 8,478 | 18,332 |
| 2005 | 32,216 | 49,082 | 47,372 | 46,235 | 44,555 | 37,255 | 32,264 | 12,971 | 8,777 | 18,870 | 22,875 | 20,501 |
| 2006 | 37,313 | 32,775 | 2,624 | -389 | -3,388 | -10,520 | -18,969 | -7,151 | 4,669 | 2,435 | 1,444 | -10,692 |
| 2007 | -49,093 | -46,154 | -3,649 | 5,257 | 11,882 | 20,095 | 27,464 | 3,109 | -6,894 | -3,393 | 4,201 | -7,137 |
| 2008 | -28,773 | -38,333 | -43,781 | -48,286 | -43,455 | -33,493 | -12,448 | 11,585 | 21,714 | 15,039 | 17,876 | 23,645 |
| 2009 | 80,960 | 92,012 | 84,991 | 86,169 | 79,811 | 67,070 | 36,361 | 26,315 | 17,368 | 21,194 | 15,442 | 7,679 |
| 2010 | -14,555 | -17,011 | -15,092 | -12,211 | -4,964 | 3,562 | 12,472 | 5,617 | -7,069 | -6,737 | -17,226 | 13,874 |
| 2011 | -5,747 | -35,105 | -34,873 | -42,802 | -50,880 | -43,600 | -21,142 | -4,631 | 12,738 | 25,736 | 46,833 | 20,538 |
| 2012 | 66,938 | 112,286 | 103,704 | 105,464 | 101,885 | 90,421 | 71,593 | 43,452 | 29,143 | 23,761 | 19,140 | 41,064 |
| 2013 | -2,011 | -7,341 | 1,130 | -6,702 | -5,997 | -10,684 | 274 | 24,044 | 28,854 | 11,365 | -11,027 | -72,700 |
| 2014 | -71,962 | -129,180 | -144,403 | -123,683 | -107,734 | -88,259 | -84,773 | -64,838 | -61,766 | -43,078 | -28,924 | 44,914 |
| 2015 | 69,846 | 147,409 | 159,334 | 138,435 | 115,642 | 84,815 | 72,393 | 48,583 | 42,845 | 34,374 | 31,566 | 2,217 |
| 2016 | 916 | -8,951 | -8,466 | -7,672 | -21,052 | -23,626 | -32,935 | -35,426 | -38,624 | -48,446 | -44,684 | -49,093 |
| 2017 | -59,097 | -56,104 | -43,636 | -44,758 | -33,391 | -27,223 | -19,610 | -16,503 | -7,724 | -11,885 | -16,179 | -5,585 |
| 2018 | 2,649 | -18,655 | -46,391 | -43,903 | -38,267 | -33,728 | -48,930 | -48,107 | -48,119 | -52,184 | -57,065 | -52,230 |
| 2019 | -40,871 | -65,560 | -53,655 | -33,200 | -16,756 | 4,229 | 24,057 | 30,637 | 31,963 | 32,914 | 31,480 | 28,602 |
| 2020 | 28,649 | 80,180 | 82,644 | 65,654 | 57,408 | 42,656 | 34,197 | 22,584 | 19,782 | 22,467 | 30,490 | 38,318 |
| 2021 | 51,741 | 13,642 | 1,277 | 3,620 | 1,671 | -57,347 | -65,732 | -61,951 | -69,151 | -66,593 | -53,525 | -62,691 |
| 2022 | -64,085 | -45,727 | -34,370 | -43,432 | -59,520 | -3,886 | 9,887 | 151 | -659 | -6,491 | -37,065 | -47,247 |
| 2023 | -58,123 | -71,149 | -84,481 | -74,440 | -52,116 | -28,059 | -19,856 | 7,493 | 29,241 | 34,657 | 63,790 | 101,517 |
| 2024 | 87,724 | |||||||||||
| - = No Data Reported; -- = Not Applicable; NA = Not Available; W = Withheld to avoid disclosure of individual company data. |
| Release Date: 3/29/2024 |
| Next Release Date: 4/30/2024 |