|
Download Data (XLS File) |
|
|||||
|
|||||
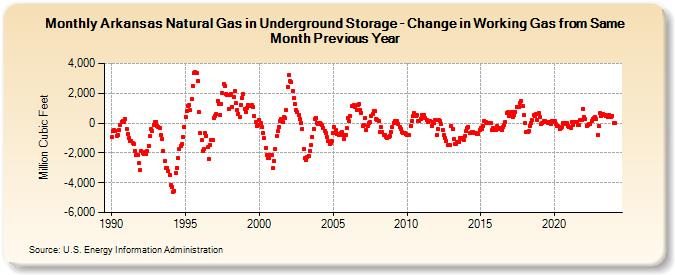
| Arkansas Natural Gas in Underground Storage - Change in Working Gas from Same Month Previous Year (Million Cubic Feet) | |||||
| Year | Jan | Feb | Mar | Apr | May | Jun | Jul | Aug | Sep | Oct | Nov | Dec |
|---|---|---|---|---|---|---|---|---|---|---|---|---|
| 1990 | -925 | -513 | -486 | -557 | -855 | -813 | -453 | -125 | 98 | 112 | 82 | 297 |
| 1991 | -381 | -716 | -999 | -1,230 | -1,199 | -1,333 | -1,373 | -1,840 | -2,119 | -2,147 | -2,697 | -3,134 |
| 1992 | -1,855 | -2,008 | -2,040 | -1,913 | -2,046 | -1,875 | -1,510 | -861 | -426 | -502 | -100 | 73 |
| 1993 | 100 | -170 | -256 | -297 | -803 | -1,041 | -1,892 | -2,556 | -2,990 | -2,986 | -3,235 | -3,455 |
| 1994 | -4,158 | -4,292 | -4,599 | -4,526 | -3,361 | -2,994 | -2,346 | -1,757 | -1,543 | -1,432 | -940 | -243 |
| 1995 | 421 | 787 | 1,168 | 1,205 | 854 | 1,599 | 2,518 | 3,389 | 3,403 | 3,357 | 2,793 | 724 |
| 1996 | -661 | -1,161 | -1,842 | -1,731 | -683 | -850 | -1,622 | -2,419 | -1,447 | -1,140 | -1,109 | 372 |
| 1997 | 484 | 595 | 1,502 | 1,257 | 545 | 1,305 | 2,018 | 2,622 | 2,502 | 1,963 | 1,863 | 970 |
| 1998 | 1,880 | 1,979 | 1,106 | 1,738 | 2,169 | 1,319 | 874 | 636 | 399 | 1,241 | 1,713 | 1,961 |
| 1999 | 921 | 720 | 1,041 | 1,210 | 1,180 | 1,139 | 1,194 | 1,064 | 459 | 73 | -203 | -149 |
| 2000 | 195 | 16 | -291 | -671 | -1,017 | -1,660 | -2,127 | -2,348 | -2,317 | -2,139 | -2,147 | -3,033 |
| 2001 | -2,573 | -1,736 | -878 | -561 | -268 | 167 | 259 | 83 | 394 | 335 | 857 | 2,427 |
| 2002 | 3,203 | 2,824 | 2,728 | 2,171 | 1,683 | 1,268 | 868 | 754 | 567 | 248 | -7 | -369 |
| 2003 | -1,719 | -2,359 | -2,465 | -2,303 | -2,175 | -1,897 | -1,485 | -899 | -384 | 276 | 343 | 23 |
| 2004 | -53 | 26 | -88 | -160 | -327 | -520 | -683 | -965 | -1,203 | -1,389 | -1,327 | -1,185 |
| 2005 | -633 | -262 | -494 | -723 | -753 | -827 | -642 | -597 | -764 | -1,082 | -783 | -313 |
| 2006 | 334 | 123 | 482 | 1,118 | 1,180 | 1,205 | 1,101 | 900 | 1,239 | 1,290 | 901 | 707 |
| 2007 | -190 | -115 | 354 | -470 | -174 | 40 | 91 | 482 | 610 | 827 | 800 | 278 |
| 2008 | 241 | 125 | -565 | -290 | -614 | -796 | -782 | -948 | -1,022 | -903 | -834 | -563 |
| 2009 | -288 | 16 | 124 | 90 | 119 | -28 | -242 | -397 | -628 | -691 | -682 | -760 |
| 2010 | -768 | -780 | -804 | -167 | 163 | 494 | 666 | 503 | 530 | 150 | 159 | 304 |
| 2011 | 575 | 489 | 552 | 334 | 196 | 79 | 110 | 142 | -170 | 50 | 17 | 219 |
| 2012 | -794 | -390 | 193 | 147 | -84 | -442 | -764 | -1,023 | -1,173 | -1,490 | -1,499 | -1,477 |
| 2013 | -225 | -404 | -1,080 | -1,386 | -1,403 | -1,240 | -1,239 | -1,024 | -1,050 | -1,022 | -1,133 | -852 |
| 2014 | -543 | -321 | -241 | -666 | -658 | -610 | -594 | -630 | -668 | -706 | -747 | -481 |
| 2015 | -353 | -362 | -180 | 126 | 87 | -6 | 9 | 15 | -10 | -494 | -325 | -461 |
| 2016 | -464 | -214 | -418 | -321 | -382 | -444 | -273 | -112 | 65 | 690 | 716 | 450 |
| 2017 | 466 | 746 | 383 | 533 | 778 | 1,064 | 1,103 | 1,112 | 1,377 | 1,476 | 1,141 | 512 |
| 2018 | -21 | -600 | -574 | -537 | -215 | 41 | 188 | 545 | 485 | 579 | 196 | 654 |
| 2019 | 420 | -57 | 23 | 143 | 129 | 60 | 65 | 20 | 81 | -33 | 169 | 70 |
| 2020 | 121 | -58 | -216 | -221 | -410 | -355 | -239 | -23 | -7 | -77 | -4 | -163 |
| 2021 | -237 | -316 | 57 | -122 | 43 | 85 | 72 | -94 | -112 | 211 | 182 | 960 |
| 2022 | 442 | 252 | -166 | -118 | -50 | -32 | 140 | 271 | 319 | 422 | 248 | -776 |
| 2023 | -207 | 708 | 477 | 619 | 518 | 564 | 454 | 393 | 529 | 381 | 430 | 478 |
| 2024 | 14 | |||||||||||
| - = No Data Reported; -- = Not Applicable; NA = Not Available; W = Withheld to avoid disclosure of individual company data. |
| Release Date: 3/29/2024 |
| Next Release Date: 4/30/2024 |