|
Download Data (XLS File) |
|
|||||
|
|||||
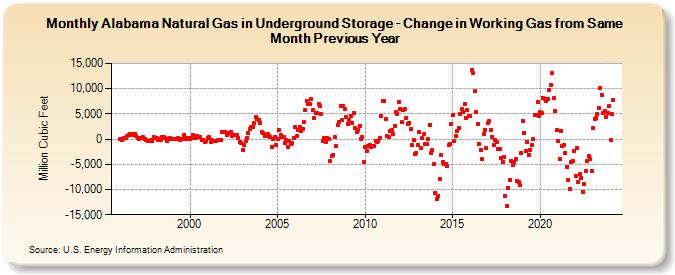
| Alabama Natural Gas in Underground Storage - Change in Working Gas from Same Month Previous Year (Million Cubic Feet) | |||||
| Year | Jan | Feb | Mar | Apr | May | Jun | Jul | Aug | Sep | Oct | Nov | Dec |
|---|---|---|---|---|---|---|---|---|---|---|---|---|
| 1996 | -67 | -133 | -30 | 123 | 233 | 669 | 826 | 998 | 743 | 933 | 994 | 633 |
| 1997 | 156 | 40 | 226 | 203 | 337 | -48 | -197 | -301 | -376 | -242 | -356 | 405 |
| 1998 | 185 | 181 | -92 | 24 | -103 | 427 | 374 | 288 | -376 | -14 | 230 | 91 |
| 1999 | 29 | 103 | 39 | -69 | 257 | -156 | 88 | -31 | 772 | 82 | 214 | 164 |
| 2000 | 63 | 175 | 802 | 599 | 219 | 615 | 462 | 381 | -131 | -196 | -533 | -430 |
| 2001 | 155 | 398 | -521 | -260 | -395 | -413 | -352 | -239 | -111 | -89 | 1,403 | 1,499 |
| 2002 | 1,415 | 858 | 1,192 | 1,255 | 1,399 | 692 | 788 | 772 | 755 | 314 | -578 | -731 |
| 2003 | -2,107 | -1,207 | -476 | 304 | 1,194 | 2,067 | 2,346 | 2,392 | 3,132 | 4,421 | 4,005 | 3,823 |
| 2004 | 3,196 | 1,431 | 1,199 | 639 | 736 | 1,085 | 709 | 390 | -1,533 | 88 | 320 | -1,136 |
| 2005 | 81 | 1,781 | 884 | 473 | 342 | -689 | -278 | -1,572 | -368 | -1,009 | -866 | 219 |
| 2006 | 2,328 | 556 | 1,832 | 2,383 | 1,625 | 1,987 | 3,482 | 5,867 | 7,485 | 6,962 | 7,014 | 7,962 |
| 2007 | 5,714 | 4,181 | 5,178 | 5,169 | 6,899 | 6,505 | 4,884 | -365 | 196 | -533 | 245 | -9 |
| 2008 | -4,351 | -3,349 | -3,111 | 508 | -1,313 | 2,715 | 3,327 | 6,659 | 3,768 | 6,518 | 6,034 | 4,452 |
| 2009 | 3,085 | 3,714 | 4,562 | 3,263 | 5,173 | 2,162 | 1,332 | 1,782 | 2,604 | 79 | 490 | -4,478 |
| 2010 | -1,498 | -2,302 | -1,430 | -1,149 | -1,508 | -1,300 | -1,408 | -446 | -622 | -383 | 294 | 4,536 |
| 2011 | 7,558 | 7,578 | 3,929 | 604 | 460 | 1,549 | 1,799 | 961 | 2,583 | 5,333 | 5,062 | 7,418 |
| 2012 | 5,940 | 3,418 | 5,848 | 5,975 | 4,096 | 3,029 | 3,273 | 1,910 | -1,258 | -235 | -3,014 | -2,853 |
| 2013 | -1,149 | 1,377 | -1,739 | 131 | 998 | -1,015 | -899 | -35 | 2,852 | -2,771 | -2,175 | -5,012 |
| 2014 | -10,639 | -11,942 | -11,229 | -7,850 | -3,244 | -4,554 | -5,013 | -4,866 | -5,399 | -1,245 | -900 | 3,074 |
| 2015 | 4,748 | -456 | 658 | 1,558 | 2,132 | 4,974 | 5,907 | 5,342 | 6,998 | 4,187 | 5,725 | 4,628 |
| 2016 | 4,615 | 13,768 | 13,039 | 9,452 | 5,305 | 3,085 | -997 | -2,191 | -4,010 | 943 | 1,886 | -1,825 |
| 2017 | 3,216 | 3,508 | 1,764 | 484 | -1,218 | -230 | -504 | -1,882 | -1,919 | -3,657 | -4,580 | -3,566 |
| 2018 | -11,342 | -13,232 | -9,621 | -8,113 | -4,357 | -5,054 | -4,547 | -3,988 | -8,285 | -8,491 | -9,174 | -2,688 |
| 2019 | 3,679 | 1,287 | -2,385 | -644 | -3,187 | -2,111 | -1,224 | 67 | 4,860 | 4,873 | 7,422 | 4,680 |
| 2020 | 5,397 | 5,205 | 8,168 | 8,028 | 7,649 | 7,881 | 9,688 | 10,811 | 13,013 | 8,141 | 5,567 | 1,740 |
| 2021 | -414 | -3,850 | 1,552 | -1,389 | -1,169 | -2,727 | -5,533 | -8,073 | -9,981 | -4,610 | -4,316 | -2,456 |
| 2022 | -7,222 | -1,683 | -8,433 | -6,999 | -7,645 | -10,441 | -9,004 | -6,335 | -4,405 | -3,407 | -3,852 | -6,278 |
| 2023 | 2,148 | 3,906 | 4,240 | 5,076 | 6,137 | 10,136 | 8,821 | 5,260 | 5,509 | 4,425 | 5,140 | 6,570 |
| 2024 | -260 | 4,967 | 7,738 | 2,947 | 1,004 | -951 | ||||||
| - = No Data Reported; -- = Not Applicable; NA = Not Available; W = Withheld to avoid disclosure of individual company data. |
| Release Date: 8/30/2024 |
| Next Release Date: 9/30/2024 |