|
Download Data (XLS File) |
|
|||||
|
|||||
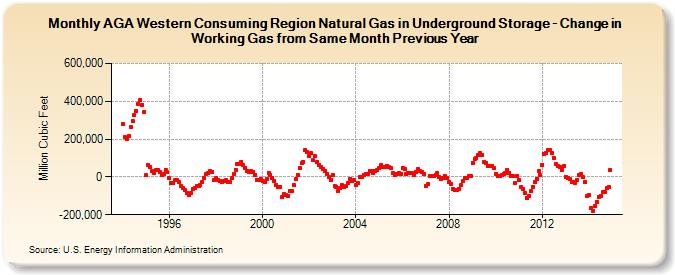
| AGA Western Consuming Region Natural Gas in Underground Storage - Change in Working Gas from Same Month Previous Year (Million Cubic Feet) | |||||
| Year | Jan | Feb | Mar | Apr | May | Jun | Jul | Aug | Sep | Oct | Nov | Dec |
|---|---|---|---|---|---|---|---|---|---|---|---|---|
| 1994 | 280,414 | 208,968 | 200,997 | 216,283 | 261,894 | 293,909 | 326,049 | 349,274 | 387,670 | 405,477 | 381,931 | 342,394 |
| 1995 | 8,494 | 61,987 | 50,414 | 30,372 | 22,397 | 34,462 | 36,108 | 23,444 | 10,774 | 13,127 | 37,918 | 24,549 |
| 1996 | -8,287 | -34,078 | -30,040 | -14,465 | -15,479 | -28,752 | -49,420 | -58,971 | -68,328 | -85,471 | -97,348 | -84,552 |
| 1997 | -64,507 | -57,811 | -49,808 | -47,271 | -41,056 | -26,112 | -6,095 | 16,328 | 21,859 | 30,055 | 27,605 | -18,937 |
| 1998 | -4,131 | -15,983 | -20,640 | -29,152 | -21,709 | -18,864 | -25,220 | -24,329 | -5,839 | 16,729 | 38,273 | 67,451 |
| 1999 | 69,515 | 80,399 | 64,585 | 48,540 | 32,484 | 23,743 | 32,276 | 27,204 | 10,505 | -13,763 | -18,901 | -10,160 |
| 2000 | -21,145 | -25,280 | -10,972 | 22,433 | 9,829 | -5,453 | -21,101 | -43,749 | -53,439 | -53,341 | -107,121 | -89,770 |
| 2001 | -97,463 | -99,714 | -74,183 | -72,793 | -42,303 | -12,575 | 10,799 | 48,937 | 71,147 | 79,356 | 142,280 | 129,722 |
| 2002 | 110,463 | 124,462 | 89,272 | 109,857 | 80,054 | 63,317 | 52,766 | 43,520 | 29,687 | 16,913 | 1,826 | -17,086 |
| 2003 | 8,160 | -47,984 | -53,164 | -75,207 | -57,645 | -45,302 | -52,552 | -50,640 | -34,477 | -9,167 | -24,298 | -18,668 |
| 2004 | -44,098 | -30,650 | 1,444 | 1,253 | 11,194 | 13,910 | 17,938 | 29,587 | 33,336 | 22,414 | 29,216 | 35,093 |
| 2005 | 45,335 | 64,457 | 54,058 | 54,441 | 59,105 | 51,623 | 46,926 | 19,961 | 8,321 | 17,957 | 19,673 | 15,650 |
| 2006 | 49,198 | 41,407 | 14,021 | 19,139 | 21,421 | 18,844 | 10,132 | 25,704 | 39,373 | 29,351 | 26,410 | 15,640 |
| 2007 | -47,359 | -39,109 | 2,591 | 3,524 | 5,198 | 9,814 | 21,271 | -1,105 | -11,697 | -5,039 | 4,170 | -7,027 |
| 2008 | -28,505 | -39,697 | -62,086 | -69,844 | -70,197 | -62,635 | -43,957 | -22,899 | -7,277 | -6,388 | 4,577 | 3,607 |
| 2009 | 75,064 | 95,835 | 102,028 | 116,844 | 124,023 | 117,017 | 79,874 | 73,751 | 59,170 | 58,099 | 57,891 | 44,776 |
| 2010 | 16,976 | 2,313 | 7,394 | 9,508 | 16,605 | 22,495 | 37,411 | 22,451 | 4,920 | 2,429 | -32,688 | 6,382 |
| 2011 | -18,184 | -54,697 | -65,799 | -85,531 | -108,962 | -99,775 | -74,883 | -51,125 | -27,448 | -9,330 | 29,409 | 8,279 |
| 2012 | 64,928 | 122,064 | 128,622 | 142,058 | 140,862 | 126,755 | 102,051 | 68,571 | 55,320 | 50,236 | 37,582 | 55,660 |
| 2013 | 1,204 | -4,720 | -9,240 | -25,659 | -25,372 | -31,378 | -17,304 | 12,344 | 14,284 | -2,777 | -26,977 | -101,451 |
| 2014 | -96,642 | -162,982 | -181,024 | -153,565 | -130,838 | -105,305 | -99,914 | -80,367 | -79,219 | -61,200 | -54,166 | 37,318 |
| - = No Data Reported; -- = Not Applicable; NA = Not Available; W = Withheld to avoid disclosure of individual company data. |
| Release Date: 4/30/2024 |
| Next Release Date: 5/31/2024 |