|
Download Data (XLS File) |
|
|||||
|
|||||
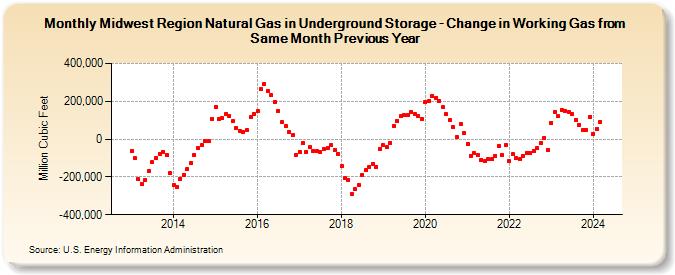
| Midwest Region Natural Gas in Underground Storage - Change in Working Gas from Same Month Previous Year (Million Cubic Feet) | |||||
| Year | Jan | Feb | Mar | Apr | May | Jun | Jul | Aug | Sep | Oct | Nov | Dec |
|---|---|---|---|---|---|---|---|---|---|---|---|---|
| 2013 | -63,664 | -102,296 | -211,632 | -235,463 | -214,379 | -166,660 | -123,165 | -100,408 | -77,814 | -65,919 | -81,637 | -181,602 |
| 2014 | -243,074 | -255,871 | -209,941 | -189,692 | -156,914 | -124,375 | -83,035 | -47,387 | -33,755 | -8,053 | -11,988 | 108,104 |
| 2015 | 168,709 | 107,663 | 110,005 | 130,381 | 120,962 | 93,959 | 58,782 | 43,062 | 37,218 | 47,788 | 119,030 | 134,031 |
| 2016 | 146,293 | 262,478 | 290,977 | 256,794 | 232,422 | 197,436 | 149,518 | 88,536 | 68,742 | 38,267 | 20,252 | -82,865 |
| 2017 | -66,250 | -19,406 | -66,556 | -42,163 | -62,490 | -62,206 | -70,390 | -52,323 | -49,044 | -33,073 | -58,206 | -76,940 |
| 2018 | -144,786 | -207,867 | -215,459 | -289,461 | -265,404 | -242,334 | -192,341 | -163,416 | -146,551 | -129,200 | -146,312 | -51,658 |
| 2019 | -32,275 | -43,852 | -19,667 | 70,277 | 95,817 | 120,726 | 124,913 | 129,440 | 143,934 | 131,552 | 122,244 | 107,698 |
| 2020 | 195,718 | 204,059 | 229,523 | 218,122 | 201,316 | 167,639 | 130,870 | 100,472 | 62,521 | 10,258 | 77,832 | 32,705 |
| 2021 | -24,701 | -87,612 | -76,105 | -85,296 | -108,844 | -117,448 | -107,015 | -107,245 | -86,927 | -37,839 | -84,832 | -30,916 |
| 2022 | -117,428 | -81,176 | -99,125 | -107,785 | -87,422 | -72,527 | -71,778 | -60,441 | -49,129 | -21,921 | 7,565 | -55,289 |
| 2023 | 85,197 | 145,940 | 120,567 | 154,825 | 150,911 | 143,615 | 131,638 | 103,587 | 76,256 | 45,884 | 47,870 | 119,172 |
| 2024 | 29,333 | 54,576 | ||||||||||
| - = No Data Reported; -- = Not Applicable; NA = Not Available; W = Withheld to avoid disclosure of individual company data. |
| Release Date: 4/30/2024 |
| Next Release Date: 5/31/2024 |